Voter Model Works for US Elections
A computer simulation of voters influencing one another over time can reproduce stable statistical patterns from US presidential elections, according to a report in Physical Review Letters. The model uses population and commuting data for every US county and assumes that voters may change their political preferences based on interactions with others at home or at work. The type of model the researchers used has not been directly compared with election data before, and the researchers believe similar models could elucidate how political and cultural opinions move through a population or remain stable over time.
Voter models are meant to simulate the spread of opinions among people. In most such simulations, the “voters” are points or “nodes” in space connected to one another in a giant network, and each voter can have one of two opinions on an issue, say pro or con. At each time step, as the simulation progresses, a rule gives the likelihood that a voter will change his or her mind based on the opinions of neighbors. Researchers have developed dozens of voter models with different mathematical details, leading to stable phenomena such as “consensus,” when all voters agree, or “clustering,” when opinions are fragmented into many small regions. But researchers have rarely compared voter model results directly with real-world opinion data.
Víctor Eguíluz of the Institute for Cross-Disciplinary Physics and Complex Systems (IFISC) in Palma de Mallorca, Spain, and his colleagues have now compared voter model results with data from recent US presidential elections. As television networks’ red-blue maps have long shown, US election results follow clear geographical patterns, with Republican-leaning states in the West and South and Democratic states clustered on the coasts. Researchers have also found a long-distance correlation: the average difference in election results between two counties increases with the logarithm of their separation distance, and this correlation remains consistent over time. Another consistent pattern is the variability from county to county of the fraction of votes (“vote share”) going to either party. In other words, the national mean changes from year to year, but the degree of county-to-county fluctuations remains roughly constant.
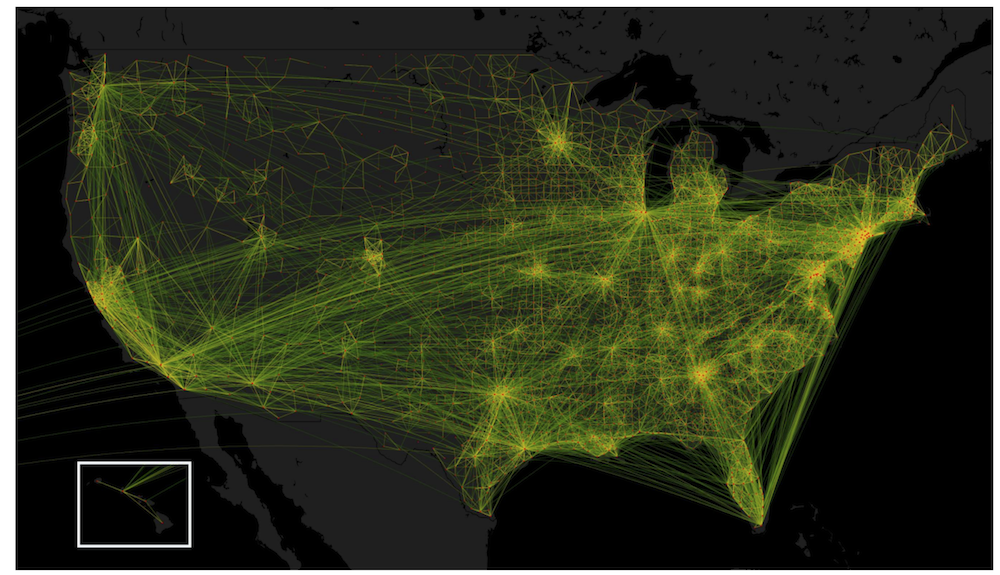
The voter model created by Eguíluz and colleagues represents each of 3117 US counties as a node with a population based on census data. The network connects each county with the counties in which its residents’ workplaces are located. To start the simulation, the team assigned each county a number of Democrats based on the 2000 election data. At each new time step, the researchers updated the numbers based on their rules for the probability of party-switching. The probability for a Democrat who works in her home county to switch parties depends on the number of Republicans in her county who might influence her but also on the number of Republicans who work in her county but live elsewhere. The team also added some uncertainty in the form of a “random noise” term to account for all other effects that determine voting choices.
This random noise turned out to be critical for reproducing two long-term, stable trends in the election data, the logarithmic distance correlations and the county-by-county voter fraction fluctuations. Too much randomness, and the red-blue map quickly fell into chaos, with red and blue counties thoroughly mixed. But with too little randomness, the correlations grew over time, eventually coloring the whole map with one color. With the randomness term tuned to about of the other effects, the simulation yielded a map whose correlations and voter fraction fluctuations remained stable over time and matched those of the US presidential election results between 1980 and 2012.
The model has limitations, the researchers stress. “We don’t predict who’s going to win, but we predict something which is behind who’s winning,” says IFISC graduate student and team member Juan Fernández-Gracia. Eguíluz says similar models could elucidate how opinions about global warming and other issues are distributed or spread over time.
“What is exciting [about the result] is the idea that one can be very quantitative about the statistical behavior of people,” says Jean-Philippe Bouchaud, a physicist at Capital Fund Management in Paris. He and a co-worker recently built a voter model that reproduced similar patterns in French election data [1]. But Bouchaud notes that such models could yield realistic patterns without accurately representing why these patterns emerge. “We have to be sure that there’s not a more trivial mechanism that would explain these logarithmic long-range correlations,” he cautions.
–Gabriel Popkin
Gabriel Popkin is a freelance science writer in Washington, DC.
References
- J.-P. Bouchaud, C. Borghesi, and P. Jensen, “On the Emergence of an ‘Intention Field’ for Socially Cohesive Agents,” J. Stat. Mech.: Theory Exp. 2014, P03010 (2014)