Diagnosing Leukemia Through Entropy
We immunologists have a problem. The immune system of mammals consists of a heterogeneous population of cells with different traits. Such diversity plays a key role in biological function, as division-of-labor within the immune system allows organisms to respond to virtually any type of infectious agent. But it also makes it more challenging to characterize immune cell populations and diagnose diseases. To understand the immune system, experimentalists categorize different types of cells by measurements of individual molecules. They can obtain a coarse characterization by studying a single cellular property, e.g., how a cell expresses a specific gene (i.e., how it uses the information encoded in the gene to direct the assembly of a protein). But current techniques allow the measurement of an increasing number of molecular properties. This may provide a more complete and nuanced view of each cell’s unique biological profile and function.
Thanks to the recent explosion of high-throughput measurement technologies, biologists can now characterize multiple properties of a single cell at a rate of thousands of cells per second. However, knowing all molecular details does not necessarily amount to new biological understanding, and we do not yet have tools to analyze such multidimensional data meaningfully. Writing in Physical Review X, Jose Vilar at the University of the Basque Country, Spain, shows how methods borrowed from statistical physics offer possible solutions to these problems [1]. Vilar analyzes multidimensional arrays of single-cell data from large heterogeneous populations of immune cells. By calculating the entropies of cell distributions, he is able to derive effective diagnostic criteria for patients with acute myeloid leukemia (AML)—a blood cancer characterized by the rapid growth of abnormal white blood cells that prevent the production of normal blood cells.
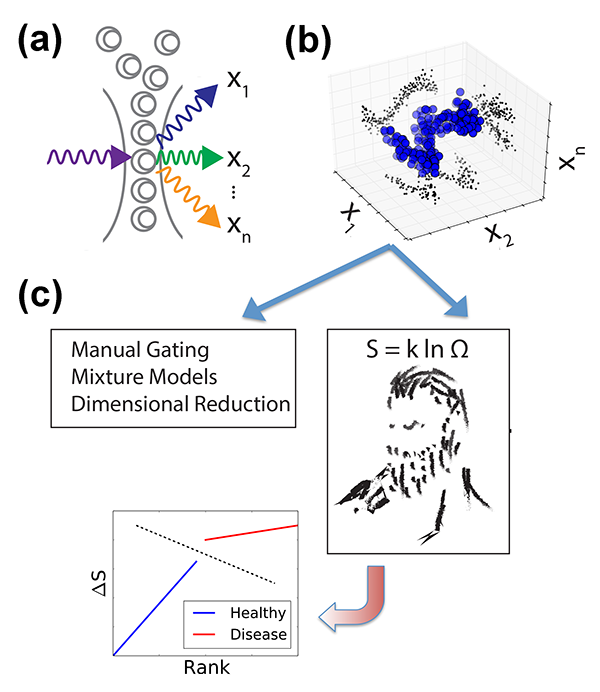
Until recently, fluorescence-based flow cytometry (FCM) has been the only technique for such multiparametric analysis of blood cells and liquid tumors. In FCM, cells are first labeled with fluorophore-conjugated antibodies that selectively bind molecules of interest (so-called “epitopes,” e.g., specific proteins on the surface of the cell, in the cytoplasm, and in the nucleus). Each cell is passed through a laser, and the fluorophore-antibody-epitope complexes within each cell emit light at a characteristic wavelength. The resulting emission intensities of each fluorophore are measured, resulting in measurements of epitope abundance for each individual cell [Fig. 1(a)]. High throughput ( cells/second) acquisition of biological samples yields distributions of molecular observables within a population of cells [Fig. 1(b)]. By using distinct fluorophores and multiple lasers, as many as ten different epitopes/cell can be currently measured, but newer methodologies [2] are expanding the scale of simultaneous observables into the thousands [3].
Researchers are thus faced with an overwhelming explosion of information. But despite the increasing experimental capabilities, in most cases, observables are analyzed in only one or two dimensions, i.e., diagnostic criteria are based on one or two proteins. The most common FCM data processing methods partition a cell population into subpopulations according to epitope abundance, picking, for instance, one to two proteins whose alterations have been found to best characterize the diseased state. Plotting in one or two dimensions only, experimentalists divide a large population into two groups that can be identified as “positive” or “negative,” based on the distribution of the epitopes of interest (a process known as “gating”). This methodology is sufficient for simple cases. For instance, chronic lymphocytic leukemia (CLL) is defined by the accumulation of a large number of aberrant cells (expressing a cell marker CD5) in the patients’ blood. Yet this gating methodology has major limitations of reproducibility and subjectivity, due, for instance, to unavoidable experimental uncertainties or to the fact that, in many real situations, distributions are not clearly defined. Another major limitation arises when one compares multiple molecular observables between populations (e.g., of healthy cells and leukemic cells). Instead of studying the difference between entire cellular distributions to find meaningful alterations, information is often collapsed to the cell average of the entire population. But this prevents the diagnosis of diseases that might result in cell distribution changes, rather than in changes of average properties. We thus still lack standardized, objective, and computationally feasible methods to incorporate population distributions and high-dimensional molecular observables into routine analysis.
Investigators are thus developing techniques that better characterize cell statistics, providing a detailed analysis of distributions of measured observables. One such method is the evaluation of mixture models [4], in which data are assumed to be a superposition of some predefined distributions that are derived from previous reference measurements. The data are decomposed as a mixture of such distributions, in a fashion that can be both quantitative and automated. While this technique is powerful, it often breaks down because distributions stray from the idealized defined model. Furthermore, interesting biology is often found in the extreme parameter values, and there is a risk that these methods will treat them as outliers in a distribution.
Now, Vilar has introduced a new powerful method to make sense of high-dimensional information and properly take into account the statistics of distributions. His results provide a tool to diagnose the disease status of patients from FCM measurements. Vilar used a dataset disseminated through a community-based challenge (DREAM6/FlowCap2 [5]), in which researchers were given a training set of FCM measurements (correctly classified as AML or healthy) and a test set of FCM data whose classification was kept secret. The key challenge was to provide a diagnostic tool able to handle heterogeneity and deliver a correct diagnosis, despite the high variability within the two classes (healthy and AML).
Vilar’s arguments proceed as follows. In an experiment we don’t always measure what causes the disease, but just a limited number of genes that may be affected by the disease. But the patient status must be dependent on many more “hidden” degrees of freedom (i.e., gene expression levels) that are not directly captured by the measurement. While such parameters cannot be accessed, they might be reflected in the general statistical properties of the system, like its entropy. In other words, healthy and sick cell populations will have different entropies. But how can one calculate the entropy of a system in which a large part of the microscopic parameters is not accessible? Vilar invokes here the principle of maximum entropy: the probability distribution that best represents the system is the one with the largest entropy. Hence, given partial knowledge obtained from experiments on a range of microscopic parameters (abundance of certain marker proteins), the principle allows him to compute, by maximizing the entropy, an estimated distribution that also includes the unobserved, hidden variables [Fig. 1(c)]. From this he derives, for each patient, a measure of “relative entropy” as the difference between the patient’s distribution and the reference distributions of diseased and healthy states deduced from the training dataset. This relative entropy allows Vilar to classify each patient as healthy or AML with almost perfect accuracy—a feat that led his approach to rank first in the DREAM6 challenge.
Vilar’s success relies on the low-noise of FCM measurements, allowing the detailed study of the distribution of a protein’s abundance within a population of cells. It is worth noting some limitations of his approach: his estimates depend on the population size and on how the population is partitioned among discrete sublevels for the calculation of entropy. But the method is sufficiently robust to parse healthy from diseased individuals. An important advantage of the technique is its scalability: as the dimensionality of experimental datasets grows (with or more acquisition channels for each cell), the method would allow the computation of entropy estimates on smaller subsets of dimensions, by defining a subspace encompassing most of a sample’s variability. All these considerations imply a great methodological improvement compared to the manual and subjective gating used in clinical labs.
As we accrue ever more molecular microscopic details about biological systems, Vilar’s study emphasizes the under-appreciated relevance of cell distributions. The success of his method illustrates how statistical physics can aid in distilling meaningful biological information from highly multidimensional microscopic measurements, potentially leading to life-saving diagnostic techniques.
References
- Jose M. G. Vilar, “Entropy of Leukemia on Multidimensional Morphological and Molecular Landscapes,” Phys. Rev. X 4, 021038 (2014)
- D. R. Bandura et al., “Mass Cytometry: Technique for Real Time Single Cell Multitarget Immunoassay Based on Inductively Coupled Plasma Time-of-Flight Mass Spectrometry,” Anal. Chem. 81, 6813 (2009); S. C. Bendall et al., “Single-Cell Mass Cytometry of Differential Immune and Drug Responses Across a Human Hematopoietic Continuum,” Science 332, 687 (2011); C. Benoist and N. Hacohen, “Flow Cytometry, Amped Up,” 332, 677 (2011); B. Bodenmiller et al., “Multiplexed Mass Cytometry Profiling of Cellular States Perturbed by Small-Molecule Regulators,” Nature Biotech. 30, 858 (2012)
- P. Dalerba et al., “Single-Cell Dissection of Transcriptional Heterogeneity in Human Colon Tumors,” Nature Biotechnol. 29, 1120 (2011); A. K. Shalek et al., “Single-cell Transcriptomics Reveals Bimodality in Expression and Splicing in Immune Cells,” Nature 498, 236 (2013)
- H. Ho, T. Lin, H. Chang, S. Haase, S. Huang, and S. Pyne, “Parametric Modeling of Cellular State Transitions as Measured with Flow Cytometry,” BMC Bioinformatics 13, Suppl. 5 (2012); S. Pyne et al., “Automated High-Dimensional Flow Cytometric Data Analysis,” Proc. Natl. Acad. Sci. U.S.A. 106, 8519 (2009)
- DREAM6/FlowCAP2. Molecular Classification of AML Challenge: http://www.the-dream-project.org