Separating the Good Hearts from the Bad

Diagnosing heart problems is normally a doctor’s job, but physicists are now using their data crunching expertise to analyze heartbeat records in hopes of distinguishing healthy from unhealthy hearts. Papers in the 16 February and 14 September issues of PRL, both involving groups at Boston University, show that several statistical measures can separate good and bad hearts into two groups, but they differ on which approach is best.
Although the heart seems to beat at a constant rate, the time between beats is actually highly variable. According to a 1993 PRL paper by Eugene Stanley of Boston University and his collaborators [1] the variations are not random, but just the opposite: There is a long-time anti-correlation between the variations in interbeat intervals at one time and those at a later time. In a sense, the heart seems to have a “memory” because shorter intervals tend to be followed by longer ones, and the effect occurs on a wide range of time-scales, from seconds to many hours. That paper found that heart records from ten heart disease patients showed significantly less anti-correlation than those of ten healthy people.
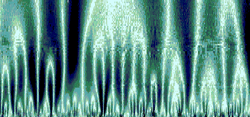
Another surprising property of heartbeat data is their lack of “stationarity”: The average interbeat interval varies with time, as do other statistical measures. To eliminate these troublesome drifts in the data, researchers use the “wavelet transform,” a mathematical manipulation. A wavelet transform for a given “scale” (50 heartbeats, for example) tends to amplify fluctuations of that specific size over all others, while eliminating drifts.
In their February paper, Mal Teich and his colleagues at Boston University re-analyzed the data set used in the 1993 paper, which by that time had grown to include 30 individuals. Based on the 24-hour electrocardiograms, they cleanly separated the healthy subjects from the heart patients using the standard deviation of the wavelet transforms for a specific range of scales (16-32 heartbeats). All of the healthy subjects’ records had larger values of this parameter than those of the heart patients.
In their latest publication, Stanley and his colleagues re-examined the data using statistical measures which do not rely on a particular scale, but measure fluctuations over a wide range of scales up to 2000 heartbeats in length. They plotted the second moment of the wavelet transforms vs. scale on a log-log plot and found that healthy hearts led to the steepest slopes, although some diseased heart records gave steeper slopes than some healthy heart records.
Both groups hope that several of these methods can be used in concert by doctors of the future to assess cardiac health, but they differ on the accuracy of each method alone. Based on their own version of the Teich group’s test, Stanley’s group shows some overlap of the healthy and unhealthy records, so they dispute the Teich et al. claim of “100% accuracy.” Stanley and colleagues show that their “scale-independent” methods give the cleanest separation. On the other hand, Teich’s group claims better separation than Stanley’s group had obtained in previous publications which used other scale-independent methods. One source of the disagreement is the teams’ use of different statistical criteria for determining the degree of separation they obtain with each method.
Leon Glass of McGill University in Quebec says there have been several previous attempts to use statistical analyses to characterize electrocardiogram data. “There’s an enormous amount of information in the heart rate variability signals,” he says, making the problem quite complex. He professes to be “agnostic” on which method will ultimately prove useful in the clinic.
References
- C.-K. Peng et al., Phys. Rev. Lett. 70, 1343 (1993)


