Melting points agree under pressure
Pinning down the melting point of even simple metals can be challenging for both experimentalists and theorists. Obstacles in the lab include the difficulty of accurately measuring temperatures in a way that properly accounts for various overheating effects, the necessity of determining the chemical reactivity of the materials, and the complicating effects of phase transitions. For theorists there is the considerable challenge of handling high temperatures in the regime where atoms no longer follow simple harmonic motion and may even undergo electronic excitations; while theory often tackles quite well structures that are stable at low temperatures, it has difficulty with high temperatures.
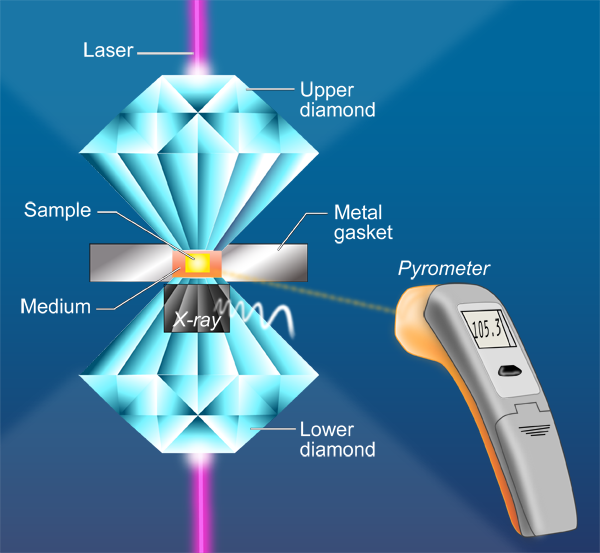
The transition metal tantalum ( Ta) provides experimentalists and theorists with a profound puzzle since its reported melting temperatures are spread over several thousand degrees (greater than a factor of 2) in the pressure range 100– 300GPa. Tantalum is also an excellent test material for comparing the results of shock compression with those from static-pressure diamond anvil data. The shock-wave method employs a rapid increase in pressure, by accelerating a projectile onto a sample of tantalum, for example. For the diamond anvil technique, a tiny tantalum sample is placed in a soft medium and held between two small diamonds that are pressed together to achieve high pressures. A laser then heats the sample and its structure is monitored by x-ray diffraction. For tantalum, recent shock compression experiments yielded melting points of ∼9700K at 300GPa [1], whereas the melting point obtained from laser-heated diamond anvil cell (LHDAC) measurements [2,3] yielded ∼3730K at 100GPa. Even with the rapid development of static methods—such as those that employ the diamond anvil high-pressure devices together with laser heating—large discrepancies remained. A similar discrepancy exists for the melting temperature of iron. Now, advances in techniques suggest that there may be a convergence of results on specific materials obtained from the various methods employed.
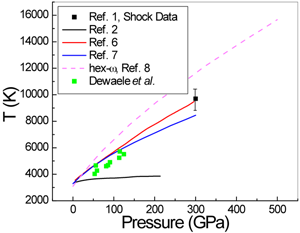
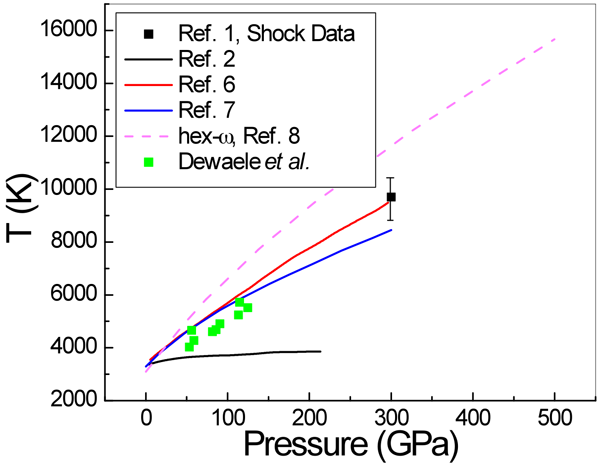
In a paper in Physical Review Letters, Agnès Dewaele and Paul Loubeyre at CEA in Bruyères-le-Châtel, Mohamed Mezouar at the European Synchrotron Radiation Facility, and Nicolas Guignot at Synchrotron Soleil, all in France, report on a series of LHDAC experiments [4] that address this discrepancy in the high-pressure melting behavior of tantalum. They considered a large number of factors—such as chemical reactions and high-temperature phase changes—that might have affected previous measurements. They also employ a carefully developed and tested temperature measurement method [5] based on a pyrometry technique that allows the measurement of temperature on a very small area (Fig. 1). They studied several media in which the tantalum sample is placed, including simple salts such as NaCl and KCl, other simple compounds MgO and Al2O3, as well as the inert gas solids neon and argon. To minimize difficulties caused by the highly reactive nature of Ta, the authors performed heating runs in a series—by gradually increasing the power of the laser—on unreacted parts of the sample that they then analyzed with x-ray diffraction. They investigated the difficulties encountered with the pyrometric method (that is, the measurement of temperature by optical means). For example, optical properties of the medium that resulted in changes of emissivity and absorption could also significantly affect the temperature observations. Dewaele et al. also checked for solid-solid phase transformations by recording an x-ray diffraction pattern along with the pyrometric measurement every 4 seconds. They report that the bcc structure was maintained up to the melting points of tantalum. Their results, shown in Fig. 2, are close to the theoretical predictions and extrapolate well to the shock-wave data.
The criterion used to identify the melting point is itself a critical part of their study and can be affected by some of the factors they note, such as chemical reactions and phase transformations. The authors identify the melting point of tantalum by a characteristic diffuse ring in their x-ray diffraction patterns. This approach would seem to be reliable because of the expected difference between the sharp rings characteristic of a crystalline phase and the broad diffuse scattering rings characteristic of a liquid. The situation, however, is more complicated. The melting can change the optical properties in the LHDAC, leading to a large difference between the temperature as measured from the pyrometric method and the actual sample temperature. The authors carefully took into account this scenario as well.
This careful and exhaustive work will challenge others attempting to improve on its results, which agree well, within the reasonable error estimates, with the recent theoretical predictions of Tailoi et al. [6] and Liu et al. [7], both of whom employed approaches that use ab initio molecular dynamics simulations. These experiments are likely not the last word on the melting temperature of Ta. Other researchers will comment on them, and have questions that lead to further studies. For example, one may need more information on exactly how the temperatures were derived from the measurements. A theory paper by Burakovsky et al. [8], also in Physical Review Letters, already raises questions regarding the results of Dewaele et al. The theorists predict, using what they characterize as a “quantum-based” model that combines density-functional calculations with ab initio molecular dynamics simulations, that there may indeed be another stable phase in tantalum below its melting point. This too invites study, since it is not necessary that a phase transition should occur at a high pressure just because another structure has a lower free energy. (There are many examples of higher energy metastable structures that exist in simple materials.) In the theory paper, the melting temperature calculated for the bcc form of tantalum agrees with the predictions of Taioli et al. for the bcc structure. It is also interesting to note that the recent shock-wave study of Dai et al. [1] did not report phase changes in Ta. In other words, the jury is still out in this aspect of high-pressure research. The current state of results for the melting curve of tantalum is summarized in Fig. 2.
So what’s next in the refinement of the melting temperature of tantalum and other metals such as iron? Clearly, as shown by Burakovsky et al.’s paper, there will be a renewed search for possible additional phases in tantalum that may complicate the measurement of the melting point. In addition, there will be continued attempts to improve the pyrometric techniques. The properties of iron are of course critically important for understanding the earth’s core and this may well be the next element whose melting point physics is critically re-examined.
Note added by author (30 June 2010): After publication, Dr. Leonid Burakovsky (Los Alamos National Laboratory) pointed out some discrepancies between the published hex- ω melting curve in Ref. [8] and the figure in the Viewpoint. The graph has been replaced with a slightly more accurate plot obtained from digitizing the published graphs.
References
- C. Dai, J. Hu, and H. Tan, J. Appl. Phys. 106, 043519 (2009)
- D. Errandonea, B. Schwager, R. Ditz, C. Gessmann, R. Boehler, and M. Ross, Phys. Rev. B 63, 132104 (2001)
- D. Errandonea, M. Soayazulu, D. Hausermann, and H. K. Mao, J. Phys. Condens. Matter 15, 7635 (2003)
- A. Dewaele, M. Mezouar, N. Guignot, and P. Loubeyre, Phys. Rev. Lett. 104, 255701 (2010)
- L. R. Benedetti and P. Loubeyre, High. Press. Res. 24, 423 (2004)
- S. Taioli, C. Cazorla, M. J. Gillan, and D. Alfe, Phys. Rev. B 75, 214103 (2007)
- Z-L. Liu, L-C. Cai, X-R. Chen, and F-Q. Jing, Phys. Rev. B 77, 024103 (2008)
- L. Burakovsky, S. P. Chen, D. L. Preston, A. B. Belonoshko, A. Rosengren, A. S. Mikhaylushkin, S. I. Simak, and J. A. Moriarty, Phys. Rev. Lett. 104, 255702 (2010)


