Atypical is normal at the metal-insulator transition
When disorder (i.e., impurities or defects) is introduced into a periodic crystal, its spatially extended electronic wave functions become localized. As localized states cannot carry an electric current at zero temperature, increasing the disorder changes a metal to an insulator. This phase transition is called the Anderson localization transition. Right at the transition point, the wave functions are neither extended nor localized but take on a multifractal character. This means they are interwoven sets of different fractals, each characterized by its own noninteger dimension. In a paper appearing in Physical Review B [1], Matthew Foster of Columbia University, Shinsei Ryu of the University of California, Berkeley, and Andreas Ludwig of the University of California, Santa Barbara, all in the US, calculate the spectrum of the fractal dimensions of a typical wave function at the Anderson transition, which is a fingerprint of its spatial structure. Remarkably, the spectrum of a single typical wave function differs considerably from that obtained by an average over all possible disorder configurations. This is caused by rare atypical configurations of the disorder that dominate the average spectrum. The calculation of Foster, Ryu, and Ludwig not only provides further insight into the transport properties of disordered materials, but also opens the door to attacking other systems where rare events dominate macroscopic physical quantities.
To understand these findings, it is instructive to recall the basic physics of Anderson localization [2,3]. The electronic wave functions in a perfect (i.e., disorder-free) -dimensional periodic crystal extend over the entire sample and have the same dimensionality as that of the crystal. (Formally, the dimensionality of a wave function can be obtained from the scaling of the probability density with sample size .) In the opposite limit of strong disorder, where wave functions are localized, their amplitude drops off exponentially away from some point ) ( is called the localization length). Once the sample size is much larger than the localization length, such localized wave functions are independent of the sample size; their dimension is thus zero. What happens between the two limiting cases? Upon introduction of weak disorder into a perfect crystal, localized states first appear in the tails of the energy bands while the states in the band center remain extended, at least in dimensions . With increasing disorder, the number of localized states increases at the expense of the extended states. The system undergoes the Anderson metal-insulator phase transition when the states at the Fermi energy become localized. Moving away from the strong-disorder limit, the localization length increases with decreasing disorder until it diverges at the transition.
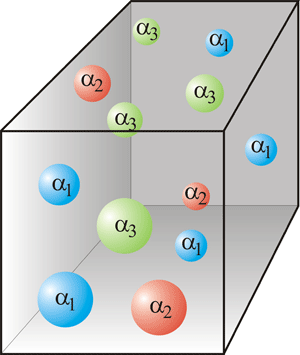
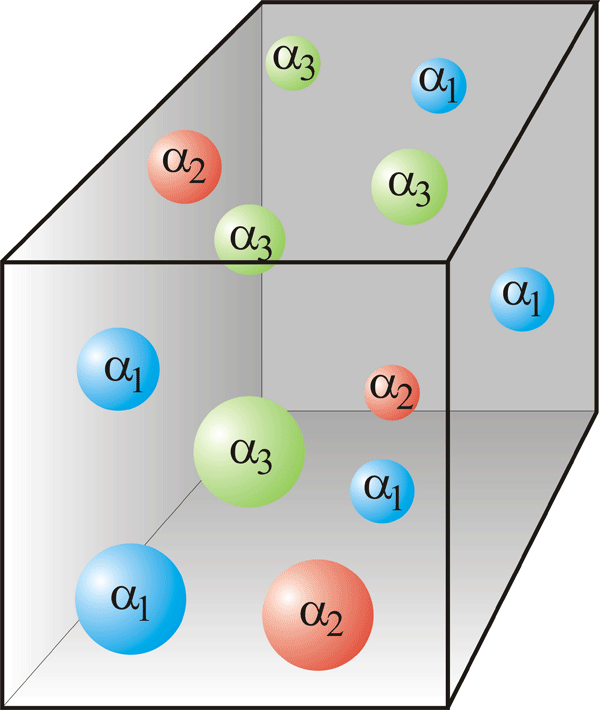
Right at the transition point, the probability density varies wildly and irregularly from place to place (in other words, it fluctuates). Its spatial structure becomes very complex and makes up a so-called multifractal [4,5]. While a simple fractal (also called a monofractal) is a set of points with a single noninteger spatial dimensionality, a multifractal can be understood as an infinite set of interwoven monofractals of different dimensionalities. A nice graph of a multifractal wave function at the Anderson transition appears in a recent publication by Vasquez, Rodriguez, and Römer [6]. To characterize such a multifractal, we define at each point in space an exponent via the sample-size dependence of the probability density, . It is called the singularity exponent and plays the role of a local fractal dimension. In a multifractal, varies from point to point, as is sketched in Fig. 1, while it is constant in a simple (mono)fractal. The ensemble of all points that share the same singularity exponent, , is itself a fractal set of fractal dimension . This means the number of points with such an scales as with system size. The function is called the multifractal (singularity) spectrum. It fully describes the probability density and thus serves as a fingerprint of the spatial structure of the wave function.
Let us now turn to the question studied in the paper by Foster, Ryu, and Ludwig, viz., how to find the multifractal spectrum at the Anderson metal-insulator transition. In experiments and in most computer simulations, one normally deals with typical wave functions occurring in a single representative sample, i.e., a single realization of the disorder. In contrast, analytical techniques so far have been focused on calculating averages over the entire set of possible disorder configurations. While averages and typical values of quantities with weak random fluctuations (i.e., those with narrow probability distributions) are generally very similar, they can display qualitatively different behavior in the presence of strong random fluctuations. As discussed above, the wave functions at the Anderson transition are characterized by wild spatial fluctuations. Therefore it is highly desirable to calculate the multifractal spectrum of a typical wave function and compare it to the disorder average.
How do Foster, Ryu, and Ludwig attack this problem? Within the standard multifractal formalism [7], the multifractal spectrum is obtained from the system-size dependence of the moments of the probability density. The disorder averages of these moments are straightforwardly calculated within the quantum field theory of Anderson localization. However, calculating the typical values of these moments [which can be defined as the geometric mean ] is more difficult. Foster, Ryu, and Ludwig overcome this obstacle by combining the usual quantum field theory with a functional renormalization group. This method follows the evolution of not just the averages but the full probability distributions of the moments under spatial coarse graining (i.e., it keeps track of entire functions, hence the name “functional” renormalization group). From the distribution of the moments, Foster, Ryu, and Ludwig obtain an analytical answer for the typical multifractal spectrum.
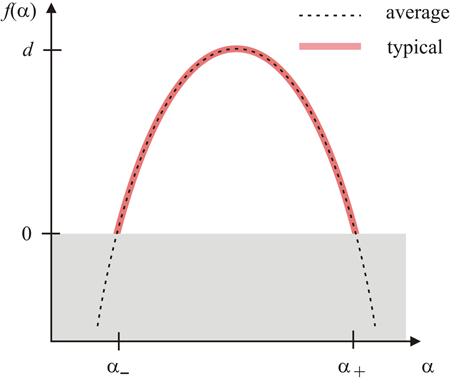
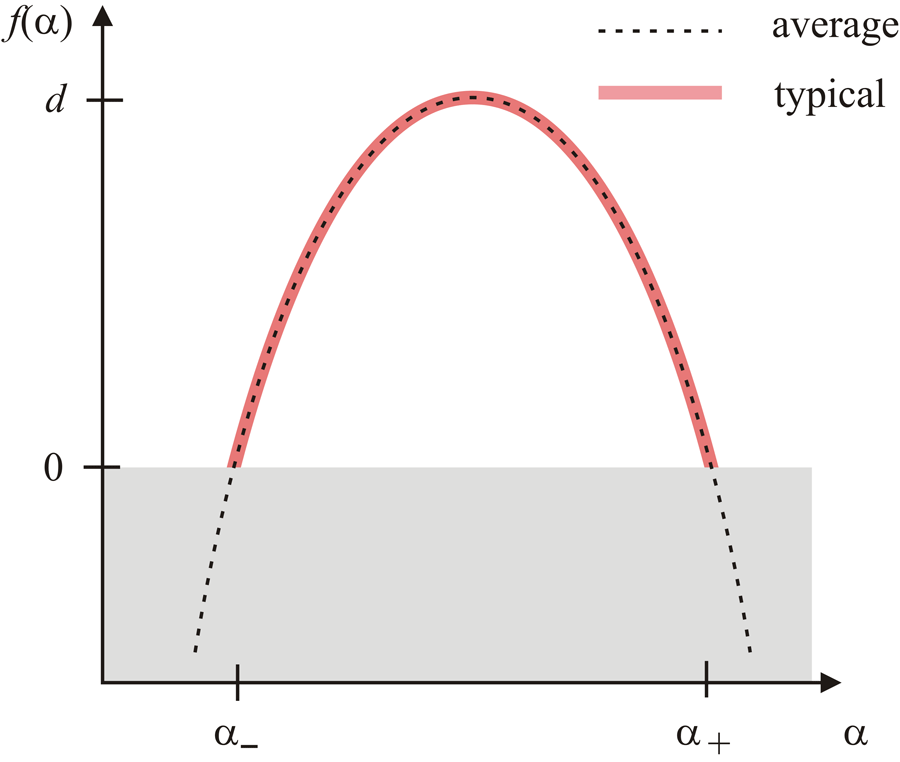
The result of this formidable calculation is sketched in Fig. 2. The spectrum at the Anderson transition has a finite width, reflecting the multifractal character of the wave function, i.e., different regions of the sample feature different singularity exponents . Importantly, Foster, Ryu, and Ludwig find a qualitative difference between the typical and average spectrums, confirming earlier heuristic arguments [8]. The typical spectrum is restricted to a finite interval [ ] where is positive, while the average spectrum extends into the region of negative . How can one understand this difference? A negative implies that the average number of (lattice) points with a singularity exponent is for sufficiently large systems. Thus such points do not occur in a typical wave function. In contrast, the ensemble average over the disorder also includes a small number of atypical configurations that contain a higher number of points with such a singularity exponent . In the region of negative , the average multifractal spectrum is thus dominated by these rare samples and their anomalously localized or delocalized states. Graphs of such anomalous wave functions can be found in a paper by Rodriguez, Vasquez, and Römer [9].
Rare fluctuations and large disorder are topics of great interest in today’s condensed matter physics with applications ranging from magnets and superconductors to moving interfaces and chemical reactions [10]. One of the central questions in this area is under what conditions rare events dominate the properties of macroscopic systems. The work by Foster, Ryu, and Ludwig demonstrates that one can deal with such rare events systematically within a controlled analytical calculation, paving the way for attacking this question in other systems.
References
- M. S. Foster, S. Ryu, and A. W. Ludwig, Phys. Rev. B 80, 075101 (2009)
- P. A. Lee and T. V. Ramakrishnan, Rev. Mod. Phys. 57, 287 (1985)
- B. Kramer and A. MacKinnon, Rep. Prog. Phys. 56, 1469 (1993)
- F. J. Wegner, Z. Phys. B 36, 209 (1980)
- C. Castellani and L. Peliti, J. Phys. A 19, L429 (1986)
- L. J. Vasquez, A. Rodriguez, and R. A. Römer, Phys. Rev. B 78, 195106 (2008)
- H. E. Stanley and P. Meakin, Nature 335, 405 (1988)
- F. Evers and A. D. Mirlin, Phys. Rev. Lett. 84, 3690 (2000); A. D. Mirlin and F. Evers, Phys. Rev. B 62, 7920 (2000)
- A. Rodriguez, L. J. Vasquez, and R. A. Römer, Phys. Rev. Lett. 102, 106406 (2009)
- T. Vojta, J. Phys. A 39, R143 (2006)


