Modulated superfluid density in an iron-pnictide superconductor
Studies of the iron-pnictide materials have dominated the field of superconductivity for the last two years. While several different families of iron-based superconductors have been discovered, they all tend to exhibit antiferromagnetic order that gives way to superconductivity when the electron density is tuned by adjusting the chemical composition, thus leading to obvious comparisons with copper-oxide superconductors [1]. The superconductor family Ba(Fe1-xCox)2As2 has received particular attention because in these materials antiferromagnetic order and superconductivity coexist over a range of cobalt concentrations. Using a scanning probe technique, Beena Kalitsky, John Kirtley, and collaborators at Stanford University and at the IBM Watson Research Center, New York, both in the US, report in two papers in Physical Review B compelling evidence that the superfluid density is not uniform in this phase, showing an enhancement along stripes corresponding to boundaries between rotated crystal domains [2,3]. The fact that the superconducting transition temperature Tc is a maximum at the cobalt concentration where the enhanced stripes just disappear suggests that the interactions involved in the magnetic order and structural distortions are important for the electron pairing, but their ordering competes with the superconducting transition.
One of the key properties of a superconductor is its ability to screen magnetic fields. When a magnetic field is applied to a superconducting object, supercurrents develop at the surfaces that cancel the magnetic field in the interior of the object. The magnetic field will decay exponentially with distance from the object’s surface, with a characteristic penetration depth λ. The higher the density of superconducting carriers, ns, the better the screening and the shorter the magnetic penetration depth; more quantitatively, ns∼1/λ2. If one applies a magnetic field near the surface of a superconductor and measures the net field as a result of the screening, it is possible to determine λ and hence ns.
To perform such a measurement with high spatial resolution, the researchers used a scanning SQUID microscope [4]. The sensor involves a tiny ( 4μm diameter) loop of superconducting wire. The presence of any magnetic flux within the loop will modify the critical current, the amount of current that can pass through the SQUID without creating a voltage. The critical current is controlled in a feedback loop to produce a signal proportional to the magnetic flux. To generate a magnetic field for probing, a wire loop of larger diameter surrounds the sensor loop. The field at the sensor position is modified by proximity to the surface of the superconducting sample. Knowing the height of the sensor loop above the superconducting surface, it is then possible to determine the magnetic penetration depth from the net magnetic field at the sensor. By rastering the SQUID across a surface, it is possible to map out variations in λ.
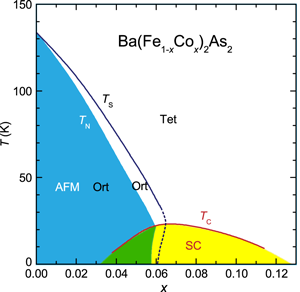
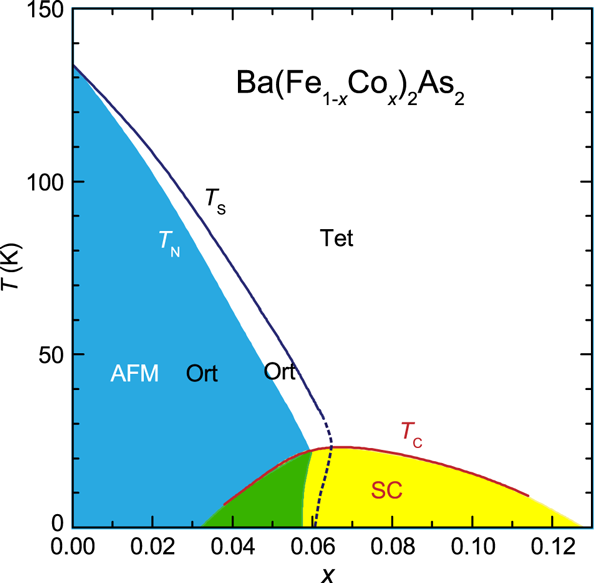
To appreciate what has been measured, we have to turn to the phase diagram for Ba(Fe1-xCox)2As2 (Fig. 1), which has been worked out by several groups using a variety of experimental techniques [5–7]. The crystal structure of this material contains iron-arsenic layers; at high temperature, the iron atoms in a layer form a square lattice, corresponding to a tetragonal crystal structure. For x≲, the square lattice distorts to rectangular (orthorhombic crystal symmetry) on cooling, with antiferromagnetic order developing at a slightly lower temperature. When an iron layer transforms from square to rectangular symmetry, there are two possible equivalent orientations of the rectangular axes, and generally both types of “twin” domains will be present. For the scanning SQUID measurements, Kalisky et al. [2] observe parallel stripes of reduced penetration depth only in orthorhombic samples and not in ones with tetragonal symmetry. The stripes have a width of (limited by experimental resolution, as determined by modeling [3]) and a typical separation of roughly . Based on the orientation and spacing of the stripes, Kalisky et al. argue that the superconducting stripes are associated with the domain walls where pairs of structural twin domains meet. Performing simulations by finite-element analysis, Kirtley et al. [3] show that the measurements are consistent with a three-dimensional (3D) model in which the stripes are just the cross section of sheets of enhanced superfluid density; these sheets could correspond to the planes formed at the intersection of pairs of 3D twin domains.
The orthorhombic phase for has received considerable attention recently. Chu et al. [8] have shown that uniaxial pressure can be used to select a single orthorhombic domain, and that the electrical resistivity parallel to the - layers shows a surprisingly strong anisotropy. Electronic anisotropy has also been detected by scanning tunneling spectroscopy in the closely related compound [9]. These anisotropic responses are clearly associated with the orthorhombic domains themselves and not with the boundaries between domains. Recent neutron diffraction studies of the ordered magnetic moments [10] and the orthorhombic strain [11] indicate that both of these quantities decrease when the temperature is lowered through the superconducting . The decreased magnetic order parameter could possibly result from the development of a nonmagnetic phase at the twin-domain boundaries, but the reduction in orthorhombic strain suggests that the superconducting order prefers regions with reduced electronic anisotropy. The latter point could be consistent with enhanced superfluid density at the twin boundaries, where the strain is presumably relaxed completely.
It should be noted that there are a few experiments on other iron-pnictide compounds that have provided evidence for spatial inhomogeneity. For example, nuclear magnetic resonance (NMR) studies using nuclei have found evidence for two distinct arsenic environments in for in an underdoped superconducting regime, close to the magnetic phase but without static magnetic order [12]. Another arsenic NMR study on at high pressure found evidence for separate but coexisting domains of magnetic order and superconductivity [13]. Then there is a study on carried out with muon-spin-rotation spectroscopy and magnetic force microscopy that suggests phase separation into antiferromagnetic and superconducting domains with a characteristic length scale of [14].
While the scanning SQUID experiment reveals inhomogeneity, it also indicates that all regions of the sample are superconducting. One of the most intriguing observations is that the stripe contrast increases on warming towards [2]. In attempts to model this behavior, the best agreement is obtained by assuming that the stripes of higher superfluid density also have a higher [3], even though each sample seems to show a single, bulk superconducting transition. Intriguingly, a new paper has just appeared [15] reporting the results of point-contact tunneling spectroscopy on a film of with that show a spectroscopic signature of superconducting pairs at temperatures as high as . Might these incoherent pairs be associated with the positions of the stripes that appear below ?
Returning to the phase diagram for , the maximum occurs just at the point where the orthorhombic strain, magnetic order, and stripe contrast disappear. The position of the maximum suggests that the interactions that lead to the ordering (structural and magnetic) instabilities are good for superconductivity, as long as one can suppress those orderings. This situation is reminiscent of the superconductors with the A-15 structure, such as and [16]. In that case, the lattice instability towards a symmetry-lowering phase transition is believed to also be responsible for the relatively high , but the occurrence of the structural transition probably limits . For the iron-based superconductors, magnetism and the degeneracy of certain orbitals are factors believed to be highly relevant to the mechanism of electron pairing. Adjusting the electron density is clearly one way to tune the interactions and optimize . The search for other ways to optimize will surely continue.
References
- M. R. Norman, Physics 1, 21 (2008)
- B. Kalisky, J. R. Kirtley, J. G. Analytis, J-H. Chu, A. Vailionis, I. R. Fisher, and K. A. Moler, Phys. Rev. B 81, 184513 (2010)
- J. R. Kirtley, B. Kalisky, L. Luan, and K. A. Moler, Phys. Rev. B 81, 184514 (2010)
- http://en.wikipedia.org/wiki/Scanning SQUID microscope
- N. Ni, M. E. Tillman, J.-Q. Yan, A. Kracher, S. T. Hannahs, S. L. Bud’ko, and P. C. Canfield, Phys. Rev. B 78, 214515 (2008)
- F. Ning, K. Ahilan, T. Imai, A. S. Sefat, R. Jin, M. A. McGuire, B. C. Sales, and D. Mandrus, J. Phys. Soc. Jpn. 78, 013711 (2009)
- J.-H. Chu, J. G. Analytis, C. Kucharczyk, and I. R. Fisher, Phys. Rev. B 79, 014506 (2009)
- J.-H. Chu, J. G. Analytis, K. D. Greve, P. L. McMahon, Z. Islam, Y. Yamamoto, and I. R. Fisher, arXiv:1002.3364v2
- T.-M. Chuang, M. P. Allan, J. Lee, Y. Xie, N. Ni, S. L. Bud’ko, G. S. Boebinger, P. C. Canfield, and J. C. Davis, Science 327, 181 (2010)
- R. M. Fernandes, D. K. Pratt, W. Tian, J. Zarestky, A. Kreyssig, S. Nandi, M. G. Kim, A. Thaler, N. Ni, P. C. Canfield, R. J. McQueeney, J. Schmalian, and A. I. Goldman, Phys. Rev. B 81, 140501 (2010)
- S. Nandi, M. G. Kim, A. Kreyssig, R. M. Fernandes, D. K. Pratt, A. Thaler, N. Ni, S. L. Bud’ko, P. C. Canfield, J. Schmalian, R. J. McQueeney, and A. I. Goldman, Phys. Rev. Lett. 104, 057006 (2010)
- G. Lang, H.-J. Grafe, D. Paar, F. Hammerath, K. Manthey, G. Behr, J.Werner, and B. Büchner, Phys. Rev. Lett. 104, 097001 (2010)
- K. Kitagawa, N. Katayama, H. Gotou, T. Yagi, K. Ohgushi, T. Matsumoto, Y. Uwatoko, and M. Takigawa, Phys. Rev. Lett. 103, 257002 (2009)
- J. T. Park, D. S. Inosov, C. Niedermayer, G. L. Sun, D. Haug, N. B. Christensen, R. Dinnebier, A. V. Boris, A. J. Drew, L. Schulz, T. Shapoval, U. Wolff, V. Neu, X. Yang, C. T. Lin, B. Keimer, and V. Hinkov, Phys. Rev. Lett. 102, 117006 (2009)
- G. Sheet, M. Mehta, D. A. Dikin, S. Lee, C. Bark, J. Jiang, J. D. Weiss, E. E. Hellstrom, M. Rzchowski, C. Eom, and V. Chandrasekhar, arXiv:1004.4852v1
- L. R. Testardi, Rev. Mod. Phys. 47, 637 (1975)


