Fermi-surface reconstruction and the origin of high-temperature superconductivity
Introduction
In crystalline lattices, the conduction electrons form waves, known as Bloch states, characterized by a momentum vector [1]. The defining characteristic of metals is the surface in momentum space that separates occupied from unoccupied states. This “Fermi” surface may seem like an abstract concept, but it can be measured and its shape can have profound consequences for the thermal, electronic, and magnetic properties of a material [2].
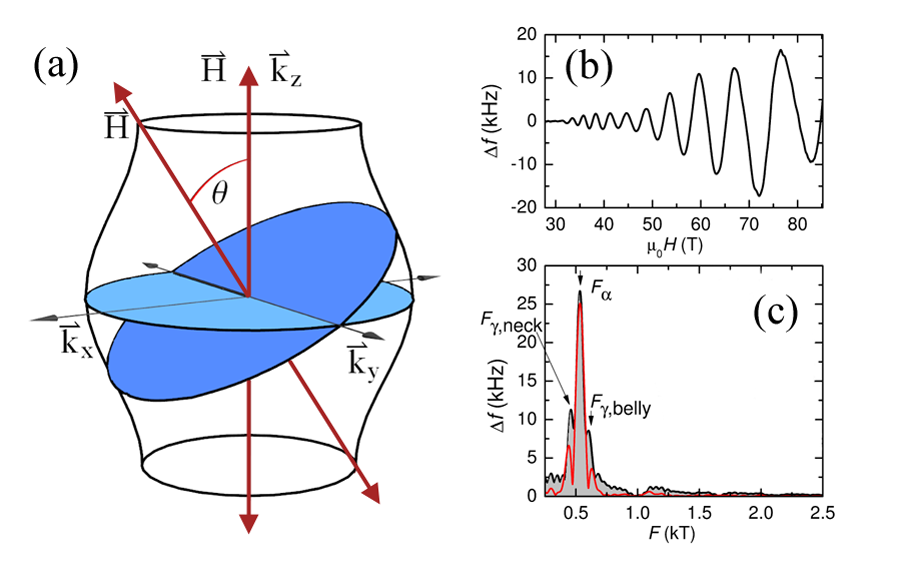
In the presence of an external magnetic field , electrons in a metal spiral around the field direction, and within a semiclassical momentum-space picture, orbit around the Fermi surface. Physical properties, such as the magnetization, involve a sum over these orbits, with extremal orbits on the Fermi surface, i.e., orbits with minimal or maximal area, dominating the sum [Fig. 1(a)]. Upon quantization, the resulting electron energy spectrum consists of Landau levels separated by the cyclotron energy, which is proportional to the magnetic field. As the magnetic field causes subsequent Landau levels to cross through the Fermi energy, physical quantities, such as the magnetization or resistivity, oscillate in response. It turns out that the period of these oscillations, when plotted as a function of , is proportional to the area of the extremal orbit in a plane perpendicular to the applied field [Fig. 1(b)]. The power of the quantum oscillation technique is obvious: By changing the field direction, one can map out the Fermi surface, much like a blind man feeling an elephant.
The nature and topology of the Fermi surface in high- cuprates has been debated for many years. Soon after the materials were discovered by Bednorz and Müller [3], it was realized that superconductivity was obtained by doping carriers into a parent insulating state [4]. This insulating state appears to be due to strong electronic correlations, and is known as a Mott insulator. In the case of cuprates, the electronic interactions force the electrons on the copper ion lattice into a configuration, with one localized hole in the shell per copper site. Given the localized nature of this state, it was questioned whether a momentum-space picture was an appropriate description of the physics of the cuprates. In fact, this question relates to a long-standing debate in the physics community: Since the parent state is also an antiferromagnet, one can, in principle, map the Mott insulator to a band insulator with magnetic order [5]. In this “Slater” picture, Mott physics is less relevant than the magnetism itself. It is therefore unclear which of the two, magnetism or Mott physics, is more fundamentally tied to superconductivity in the cuprates.
In the next section, we examine early efforts to perform quantum oscillation experiments to map the cuprate Fermi surface, and then the considerable success of photoemission spectroscopy in addressing this challenge. This will be followed by a discussion of the recent state-of-the-art quantum oscillation experiments in cuprates that reveal a profound reconstruction of the Fermi surface, a finding that theorists are just beginning to comprehend.
Early efforts
Since superconductivity is an instability of the normal state, the Fermi surface in the normal state should provide clues regarding the pairing mechanism, and in the case of the cuprates, have some bearing on the debate over whether the Mott or Slater picture is most appropriate, as well. Hence within a few years of the Bednorz-Müller discovery, there was much interest in what quantum oscillation measurements would reveal, and several such experiments appeared [6–8]. These were done on ( ) at an oxygen concentration where the superconducting transition temperature was the highest ( ). Surprisingly, these studies revealed the presence of a small Fermi pocket, much smaller than the large holelike Fermi surface predicted by paramagnetic band theory [9]. The best known of these experiments was done at Los Alamos [6], and involved measuring the magnetization of the sample while explosively compressing a magnetic flux onto the sample, resulting in its ultimate destruction. But in a pointed critique, a group at the University of Bristol reanalyzed the data and demonstrated that the oscillations were more periodic in time than in [10]. As a consequence, this line of endeavor died out.
ARPES
Efforts to map the Fermi surface by quantum oscillations were replaced by angle-resolved photoemission spectroscopy, known as ARPES, where one measures the electrons ejected from a sample due to incident photons [11]. Photoemission has a long history, and in fact it was Einstein’s explanation of the photoelectric effect that garnered him his Nobel Prize. It was many years later, though, that C. N. Berglund and W. E. Spicer [12], among others, realized that photoemission could actually be used to map out the dispersion of the electronic states as a function of momentum, and therefore the Fermi surface itself. Moreover, photoemission provides a direct map of the Fermi surface, and therefore has advantages over the quantum oscillation technique where one has to guess where the centers of the extremal orbits are at, usually with the help of band theory. Photoemission, though, suffers from a number of problems. It is a surface sensitive probe (and thus sensitive to surface reconstruction), and as a consequence, it directly maps only the momentum components parallel to the surface. The third component has to be determined by sweeping the photon energy. Moreover, it has poorer resolution than the quantum oscillation technique.
At about the time the early oscillation experiments were being carried out, Juan Carlos Campuzano’s group at Argonne National Laboratory reported the observation of the cuprate Fermi surface by photoemission [13]. They found a large Fermi surface consistent with band structure calculations. Although not completely accepted at that time because of the relatively poor data quality, in subsequent years, this result has been confirmed in great detail using samples with higher quality surfaces [14,15]. Moreover, the advent of advanced detectors, and the use of lasers as a light source, has greatly enhanced the resolution of photoemission, to the point where it is now one of the key probes of cuprates and other strongly correlated electron materials. What these later ARPES studies have revealed is that as the doping is reduced towards the insulating phase, the large Fermi surface does not remain intact, but breaks up into patches that look like arcs (Fig. 2).
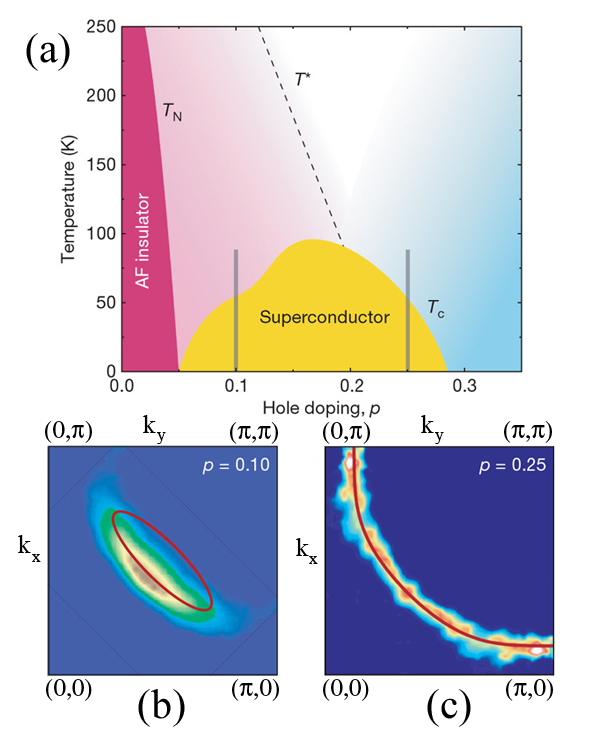
In the superconducting state, of course, the Fermi surface is gapped, leading to isolated gapless points in momentum space due to the nodes of the -wave order parameter [16]. Most interestingly, though, the Fermi surface was also found to break apart in the so-called “pseudogap” phase above the superconducting critical temperature . From the phase diagram [Fig. 2(a)], the pseudogap appears to be connected with the Mott insulator at zero doping, and this has been emphasized in numerous studies [17,18]. Early on, the pseudogap was known as the “spin” gap since it was first observed by nuclear magnetic resonance that measures the spin susceptibility [19]. Subsequently, though, it was seen in a number of charge probes as well, such as the infrared conductivity [20]. But its observation by photoemission qualitatively changed the field [21]. In its initial observation by ARPES, it appeared as if the Fermi surface were truncated, though at the time, the authors were cautious whether this represented a true reconstruction of the Fermi surface into small pockets or not. If it were pockets, then some kind of density-wave reconstruction of the Fermi surface might be its origin, since doping an antiferromagnetic insulator should lead to small pockets centered at the ( ) points of the Brillouin zone. This was exactly the region of the zone where gapless behavior was observed by ARPES.
But studies shortly after this revealed that the same -wave-like energy gap seen in the superconducting phase persisted into the pseudogap phase [22,23]. This led to the subsequent observation that the truncated Fermi surface (the “arcs” shown in Fig. 2) were temperature dependent, collapsing to nodes below , and recovering the full Fermi surface above , the temperature above which the pseudogap vanishes [24]. A natural explanation of these findings would be that the pseudogap phase was simply a precursor to the superconducting phase, with preformed Cooper pairs, but no long-range phase coherence [25]. But the question remained whether these Fermi “arcs” were simply one side of a small pocket, with the other side perhaps invisible because of low intensity due to “coherence” factors associated with the mixing of states and in a density wave with ordering vector .
Quantum oscillations redux
This is where matters more or less stood when, in 2007, the first definitive magnetic oscillations on underdoped YBCO were reported by the group of Louis Taillefer [26]. These measurements were made possible by the beautiful crystals, grown by the British Columbia group, that were carefully tuned in doping to form a highly ordered composition known as the ortho-II phase [27]. As with the earlier oscillation studies [6–8], Taillefer’s group observed a small pocket. But this time, there was little doubt that they reflected the Fermi surface. Subsequent work has shown a wonderful consistency of the oscillations with the predictions of semiclassical theory [2], including periodicity in [28]. If one dopes an antiferromagnetic insulator, the result should be small hole pockets centered at the ( , ) points (Fig. 2), and they indeed suggested this as a possible explanation of their results. One side of these pockets would then be the “Fermi” arcs observed by photoemission [29].
Interestingly, this initial observation of oscillations was in the Hall resistance, which was found to be negative—a surprise. The metallic phase is formed by doping holes, not electrons, into the insulator, and therefore previous Hall studies had mostly seen a positive Hall number. There were two exceptions. Just below at low fields, a negative value was sometimes observed that was attributed to a contribution from the superconducting vortices [30]. It has been suggested that the negative sign is due to charge accumulation in the vortex cores [31]. On the other hand, the oscillation studies were done at low temperatures and high fields, a very different regime. Of more direct relevance, a negative Hall signal had been observed in the past near a doping of [32]. This is the doping where stripes can be stabilized in certain cuprates [33]. In the stripe picture, the doped holes segregate into one-dimensional rivers of charge, separated by undoped antiferromagnetic regions [34]. These ideas led to another study by Louis Taillefer’s group, where they asserted that the observed pocket was not a hole pocket, but rather an electron one, centered near [35]. Subsequent work discovered that the Hall resistance is negative in a dome centered at , consistent with it being associated with stripes [36]. Motivated by Ref. [35], such electron pockets were indeed found in theoretical calculations involving a magnetic stripe potential with a periodicity consistent with [37]. Similar results hold for other periodicities [38,39]. Interestingly, these pockets were absent when only a charge potential was considered [37]. Other explanations were put forward as well. Commensurate antiferromagnetism gives rise to electron pockets, but with much larger hole pockets present as well [40]. -density wave order also leads to similar pockets [41].
But there was another group of ideas. This is connected with earlier suggestions that the pseudogap is a continuation of the superconducting state. Although it is clear that the measurements have mostly been done above the resistive upper critical field of the sample, it is quite possible that a “vortex liquid” phase persists to much higher fields. It has been suggested that the oscillations are set by the vortex separation, which would then have an oscillation period that scales as [42,43]. But this was disproved by subsequent oscillation studies that revealed a clear dependence over a broad field range [28]. Still, the presence of vortices could lead to other interesting effects, even in the presence of density-wave ordering [44].
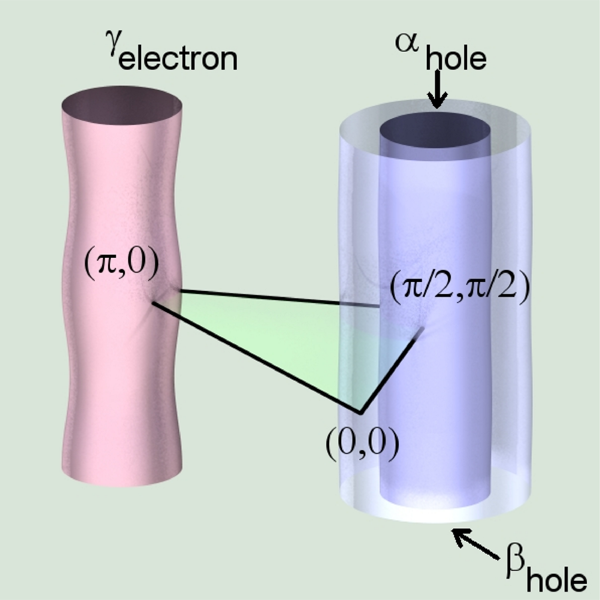
Since the initial results of Ref. [26], there have been a number of other quantum oscillation studies. Oscillations have been seen for several dopings in near , and also in the related stochiometric compound [45]. Oscillations have been seen in the longitudinal resistance, the magnetization, the skin depth, and even in the specific heat [46]. Three closely spaced frequencies have now been resolved, with the middle one having the dominant amplitude [47] (Fig. 1). The initial explanation was that these were due to -axis warping of two bilayer split cylinders ( having two planes per unit cell), but recently this has been challenged by the Cambridge group, who assert that (i) the bilayer splitting is suppressed by antiferromagnetic coupling between the two planes of the bilayer [48]), (ii) the warping is only present on the electron pocket due to the strong dependence of the -axis hopping [49], and (iii) the central dominant frequency actually arises from a hole pocket centered near ( , ) [50] (Fig. 3). They suggested that the equivalence of the electron and hole pocket areas leads to an excitonic instability of the Fermi surface, explaining why they had observed a disappearance of the oscillations for dopings below , along with a strong mass renormalization of the carriers as they approached this critical doping [51]. If, though, the dominant frequency were the electron pocket, as previously suggested, then its disappearance below could be due to a Lifshitz transition, where the electron pockets (each separated the ordering wave vector ) touch at a critical doping and the orbits become open in the Brillouin zone [39,36].
There were two other observations of the Cambridge group that have been equally interesting. First, they observed a larger frequency with a value about times larger than the dominant frequency in some (but not all) of their samples [52]. So far, this frequency has not been reported by other groups, but has obvious implications, since only a larger hole pocket would be consistent with the required Luttinger count of the occupied Fermi-surface area matching the observed doping [50]. Of perhaps even greater interest was their lack of observation of “spin zeros” [53], which was confirmed in greater detail in a later study [50]. Such zeros are due to interference of the orbits from Zeeman-split Landau levels. Their lack of observation would be consistent with a spin-density wave (SDW) state if the spins were aligned perpendicular to the field as typically occurs in an antiferromagnet, which tends to quench the Zeeman splitting. A subsequent study by the British Columbia group, though, has claimed that spin zeros do exist based on the nontrivial dependence of the oscillation amplitude on the angle the magnetic field makes with the sample [54]. Ramazashvili [55], following an earlier study of Kabanov and Alexandrov [56], has suggested that this debate can be used to resolve the issue of the location of the pockets. Hole pockets in this “transverse” SDW state should have no Zeeman splitting, but no such symmetry protects the electron pockets. Numerical studies have indicated that the electron pockets have their Zeeman splitting strongly reduced in the transverse case as well [57]. The upshot is that if the Cambridge group is correct, then one has a transverse SDW, but the pockets could be either holes or electrons. On the other hand, if the British Columbia group is correct, one either has a longitudinal (or canted) SDW, or a nonmagnetic state like a -density wave.
So far, no oscillations have been seen beyond about [58], presumably due to sample quality. However, in overdoped (Tl2201), the large Fermi surface predicted by paramagnetic band theory has been observed [59]. The results seem more or less consistent with Fermi-liquid theory [60]. But this leaves a large doping range spanning the optimal doped regime where no magnetic oscillations have yet been reported. Obviously, finding oscillations in this range is of some importance if one wants to understand in detail how the large Fermi surface breaks up upon reducing the doping into the pseudogap region. And although the attention here has been devoted to hole-doped cuprates, recently, quantum oscillations have also been seen in their electron-doped counterparts [61].
Connection to ARPES and neutron scattering data
As can be imagined, the observation of quantum oscillations has, in turn, had an impact on subsequent photoemission studies. A hole pocket centered at ( , ) was claimed, based on ARPES studies of [62], consistent with ordering, though their nonstructural interpretation is somewhat controversial since this is also a Bragg vector of the low-temperature orthorhombic crystal structure of this material. A possible incipient hole pocket was inferred in underdoped based on the particle-hole asymmetry of the ARPES spectra near the tips of the Fermi arcs above [63], though they found symmetric behavior near the antinode where the large Fermi surface crosses the zone boundary near . This motivated their speculation that a density wave and pairing gap might coexist. A definitive small hole pocket was subsequently observed in underdoped by Zhou’s group [64], which they claimed to coexist with a longer “arc,” though this arc might simply be an extension of the pocket due to broadening. Interestingly, the backside of the pocket has constant intensity around it, which is not what would be expected based on density wave coherence factors, making one wonder, as well, about a structural explanation for the pocket. If it is of electronic origin, the vector needed to reproduce the pocket location would be a diagonal vector of the form , quite different from the vector seen in stripe-ordered compounds. Other groups find different results, including a -wave energy gap, even for heavily underdoped nonsuperconducting compounds [65].
Regardless, if electron pockets do exist, they pose a number of issues. All ARPES groups are in agreement that a pseudogap exists in a large region of the zone around , which is exactly where electron pockets would be if they exist (Fig. 3). Now, magnetic oscillations have been seen in -wave superconductors well below the upper critical field where superconductivity disappears [66]. This means that oscillations can exist even in the presence of an energy gap. Still, one would expect a reduced oscillation amplitude as a consequence of the gap, which has not been reported yet. Of even bigger concern is that neutron scattering does not reveal the presence of density-wave order at zero field for any doping where oscillations have been reported. On the other hand, such order does appear if a field is applied [67]. This raises the question whether the Fermi surface reconstruction is “field-induced,” or whether it is “field-revealed”; the latter meaning that superconductivity needs to be suppressed to reveal the true pseudogap state. It should also be remembered that the low-field–high-temperature phase being probed by ARPES could well be different from the high-field–low-temperature phase probed by quantum oscillations [68].
Central to all of these questions is the nature of the pseudogap phase. Symmetry breaking below has been reported by polarized neutron studies [69]. They are consistent with a magnetic state that is not a ferromagnet. This is at odds with the dominant view of the oscillations that they are due to density-wave reconstruction of the Fermi surface into small pockets caused by a finite vector. Moreover, superconductivity is also a order parameter. Although diamagnetic fluctuations do not exist all the way up to [70], it is quite possible that the pairs themselves exist up to . This is consistent with some interpretations of ARPES data in the pseudogap phase as being due to a pairing gap [71]. Quantum oscillation studies could perhaps address this question by pushing into the lower field regime and comparing oscillations below the resistive upper critical field to those above.
Conclusion
So, what does this all have to do with the origin of high-temperature superconductivity? Superconductivity is an instability of the normal state, and the normal state from which it emerges over much of the phase diagram is the pseudogap phase. If the latter were a spin-density, or related, state [72], one might expect that superconductivity had something to do with magnetic correlations. But a order parameter [69], such as the circulating current phase proposed by Varma [73], would point to quite different physics. Moreover, there is the intriguing observation of broken rotational symmetry below from recent studies of the Nernst effect [74]. Understanding why the oscillations disappear for dopings below [51], and observing oscillations for [58], could help tremendously in sorting out the origin of the pseudogap phase, its relation to high-temperature superconductivity, and perhaps, ultimately, resolve the famous Mott-Slater debate.
References
- J. M. Ziman, Principles of the Theory of Solids (Cambridge University Press, Cambridge, 1972)[Amazon][WorldCat]
- D. Shoenberg, Magnetic Oscillations in Metals (Cambridge University Press, Cambridge, 1984)[Amazon][WorldCat]
- J. G. Bednorz and K. A. Müller, Z. Phys. B 64, 189 (1986)
- P. W. Anderson, Science 235, 1196 (1987)
- J. G. Slater, Phys. Rev. 82, 538 (1951)
- C. M. Fowler et al., Phys. Rev. Lett. 68, 534 (1992)
- G. Kido, H. Katayama-Yoshida, and T. Takahashi, J. Phys. Chem. Solids 53, 1555 (1992)
- E. G. Haanappel et al., J. Phys. Chem. Solids 54, 1261 (1993)
- W. E. Pickett, Rev. Mod. Phys. 61, 433 (1989)
- M. Springford, N. Harrison, P. Meeson, and P.-A. Probst, Phys. Rev. Lett. 69, 2453 (1992)
- S. Hufner, Photoelectron Spectroscopy (Springer, Berlin, 1995)[Amazon][WorldCat]
- C. N. Berglund and W. E. Spicer, Phys. Rev. 136, A1030 (1964)
- J. C. Campuzano et al., Phys. Rev. Lett. 64, 2308 (1990)
- A. Damascelli, Z. Hussain, and Z.-X. Shen, Rev. Mod. Phys. 75, 473 (2003)
- J. C. Campuzano, M. R. Norman, and M. Randeria in The Physics of Superconductors edited by K. H. Bennemann and J. B. Ketterson (Springer, New York, 2004), Vol. II[Amazon][WorldCat]
- Z.-X. Shen et al., Phys. Rev. Lett. 70, 1553 (1993)
- R. B. Laughlin, Phys. Rev. Lett. 79, 1726 (1997)
- P. A. Lee, N. Nagaosa, and X.-G. Wen, Rev. Mod. Phys. 78, 17 (2006)
- W. W. Warren, Jr., et al., Phys. Rev. Lett. 62, 1193 (1989)
- T. Timusk and B. Statt, Rep. Prog. Phys. 62, 61 (1999)
- D. S. Marshall et al., Phys. Rev. Lett. 76, 4841 (1996)
- H. Ding et al., Nature 382, 51 (1996)
- A. G. Loeser et al., Science 273, 325 (1996)
- M. R. Norman et al., Nature 392, 157 (1998)
- V. Emery and S. A. Kivelson, Nature 374, 434 (1995)
- N. Doiron-Leyraud et al., Nature 447, 565 (2007)
- R. Liang, D. A. Bonn, and W. N. Hardy, Phys. Rev. B 73, 180505 (2006)
- S. E. Sebastian et al., Phys. Rev. B 81, 140505 (2010)
- S. R. Julian and M. R. Norman, Nature 447, 537 (2007)
- T. Nagaoka et al., Phys. Rev. Lett. 80, 3594 (1998)
- Y. Chen, Z. D. Wang, J.-X. Zhu, and C. S. Ting, Phys. Rev. Lett. 89, 217001 (2002)
- T. Adachi, T. Noji, and Y. Koike, Phys. Rev. B 64, 144524 (2001)
- J. M. Tranquada et al., Nature 375, 561 (1995)
- S. A. Kivelson et al., Rev. Mod. Phys. 75, 1201 (2003)
- D. LeBoeuf et al., Nature 450, 533 (2007)
- D. LeBoeuf et al., arXiv:1009.2078
- A. J. Millis and M. R. Norman, Phys. Rev. B 76, 220503 (2007)
- N. Harrison, Phys. Rev. Lett. 102, 206405 (2009)
- M. R. Norman, J. Lin, and A. J. Millis, Phys. Rev. B 81, 180513 (2010)
- W.-Q. Chen, K.-Y. Yang, T. M. Rice, and F. C. Zhang, Europhys. Lett. 82, 17004 (2008)
- S. Chakravarty and H.-Y. Kee, Proc. Natl. Acad. Sci. U.S.A. 105, 8835 (2008)
- A. S. Alexandrov, J. Phys. Condens. Matter 20, 192202 (2008)
- A. Melikyan and O. Vafek, Phys. Rev. B 78, 020502 (2008)
- K.-T. Chen and P. A. Lee, Phys. Rev. B 79, 180510 (2009)
- E. A. Yelland et al., Phys. Rev. Lett. 100, 047003 (2008); A. F. Bangura et al., 100, 047004 (2008)
- S. C. Riggs et al., arXiv:1008.1568
- A. Audouard et al., Phys. Rev. Lett. 103, 157003 (2009)
- D. Podolsky and H.-Y. Kee, Phys. Rev. B 78, 224516 (2008)
- S. Chakravarty, A. Sudbo, P. W. Anderson, and S. Strong, Science 261, 337 (1994)
- S. E. Sebastian et al., Phys. Rev. B 81, 214524 (2010); see also Andrey Chubukov, Physics 3, 54 (2010)
- S. E. Sebastian et al., Proc. Natl. Acad. Sci. U.S.A. 107, 6175 (2010)
- S. E. Sebastian et al., Nature 454, 200 (2008)
- S. E. Sebastian et al., Phys. Rev. Lett. 103, 256405 (2009)
- B. J. Ramshaw et al., arXiv:1004.0260
- R. Ramazashvili, arXiv:1006.0167
- V. V. Kabanov and A. S. Alexandrov, Phys. Rev. B 77, 132403 (2008)
- M. R. Norman and J. Lin, Phys. Rev B 82, 060509 (2010)
- J. Singleton et al., Phys. Rev. Lett. 104, 086403 (2010)
- B. Vignolle et al., Nature 455, 952 (2008)
- A. F. Bangura et al., Phys. Rev. B 82, 140501 (2010)
- T. Helm et al., Phys. Rev. Lett. 103, 157002 (2009)
- J. Chang et al., New J. Phys. 10, 103016 (2008)
- H.-B. Yang et al., Nature 456, 77 (2008)
- J. Meng et al., Nature 462, 335 (2009)
- U. Chatterjee et al., Nature Phys. 6, 99 (2010)
- R. Corcoran et al., Phys. Rev. Lett. 72, 701 (1994)
- D. Haug et al., Phys. Rev. Lett. 103, 017001 (2009)
- T. Senthil and P. A. Lee, Phys. Rev. B 79, 245116 (2009)
- B. Fauque et al., Phys. Rev. Lett. 96, 197001 (2006)
- L. Li et al., Phys. Rev. B 81, 054510 (2010)
- A. Kanigel et al., Phys. Rev. Lett. 101, 137002 (2008)
- S. Sachdev, Phys. Status Solidi B 247, 537 (2010)
- C. M. Varma, Phys. Rev. B 73, 155113 (2006)
- R. Daou et al., Nature 463, 519 (2010)