Hydrogen Hides Surprises at High Pressure
Hydrogen is the most abundant element in the Universe, comprising about 75% of visible matter. Under ambient conditions on Earth, hydrogen is a diatomic gas. But its behavior at high pressures and temperatures may be dramatically different. For example, some extra-solar gas-giant planets may conceivably have a mantle of frozen hydrogen floating on a core of liquid hydrogen. And extremely high pressures, according to a 1935 prediction, could turn hydrogen into a metal [1] in which quantum effects may lead to superconductivity [2]. Experimental efforts, spanning decades, have aimed at characterizing hydrogen’s phase diagram under extreme conditions, but large uncertainties have remained.
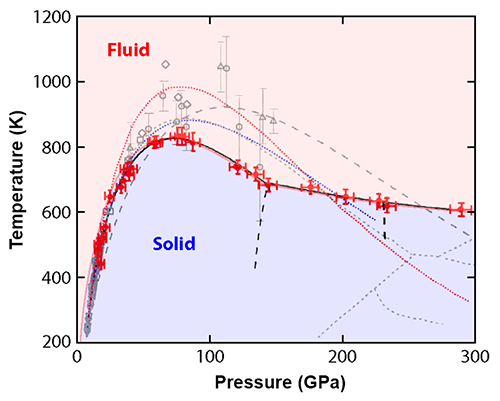
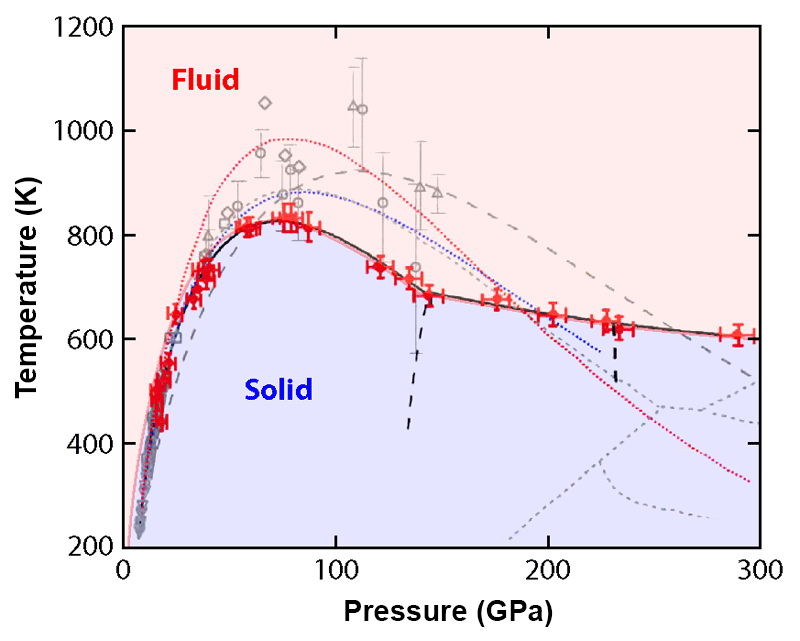
Now, Chang-sheng Zha at the Carnegie Institution of Washington and co-workers [3] have carried out high-precision measurements of the melting curve of hydrogen, which traces the melting temperature of solid hydrogen as a function of pressure. Measuring such a curve in a range of pressures extending up to 300 GPa, they found that it is substantially lower and has a different slope than what’s predicted by virtually all existing theoretical models. The findings thus call for a significant revision of our theories describing hydrogen under extreme conditions.
Previous research raised critical questions about the melting curve of hydrogen. Beginning in 2000, experiments began to suggest that the melting temperature of hydrogen reaches a maximum of K at around 100 GPa [4–9] and then decreases as the pressure is further increased. That is, the melting curve has a negative slope. Such a behavior is unusual: For most materials, the melting temperature increases with pressure [10]. Based on thermodynamic arguments, a positive slope of the melting curve implies that solids sink in their melts. A melting curve with a negative slope tends to be associated with anomalous behavior, of which water is the most common example. The negative slope of water’s melting curve (caused by the pressure-induced suppression of hydrogen bonding) is related to the fact that ice is less dense than liquid water and floats on it. Could hydrogen exhibit similar behavior? Unfortunately, because of the challenges involved with high-pressure melting measurements, the data from the early experiments were too noisy and did not cover a sufficiently large pressure range to precisely characterize the negative slope of hydrogen’s melting curve.
High-pressure studies of hydrogen typically employ a diamond anvil cell (DAC) made of two diamonds holding a few-micrometer-thick gasket containing a tiny sample of hydrogen. The pressure on the sample can be raised up to hundreds of GPa by pushing the tips of the diamonds against each other. In such a setup, researchers can heat the samples using either resistive heating or high-power laser beams and probe them with visible or x-ray light that passes through the transparent diamonds.
Confining samples at high temperatures, however, is challenging because hydrogen becomes reactive and mobile, diffusing into the diamonds and the gasket. This can lead to sample loss and diamond anvil breakage. Because of these problems, early studies of melting using resistive heating were limited in both pressure and temperature. Laser-based techniques overcame these challenges by using laser pulses to rapidly heat a metallic absorber in contact with the hydrogen sample. This optimizes the heating geometry and minimizes the time over which the hot hydrogen remains in contact with the anvils and gasket. However, the data from these experiments are difficult to analyze, mostly because laser heating leads to nonuniform temperature distributions that are hard to control and account for. Moreover, above 60 GPa, the melting point is difficult to identify because the signals typically used to reveal the melting transition, such as shifts in intramolecular vibrational frequencies and changes in the refractive index, are small and hard to detect.
Zha and co-workers bypassed many of the issues associated with laser heating by refining the older resistive-heating approach. They achieved more accurate measurements with an improved DAC design that provided better thermal isolation of the sample from the cell; careful repolishing of the anvil surface to eliminate microscopic defects; and the use of a tungsten gasket to limit hydrogen diffusion. To unambiguously detect the onset of melting, they deployed Raman spectroscopy, which can measure both internal vibrations of the molecules (vibron modes) and vibrational modes associated with the collective motion of the solid lattice (lattice modes). As the temperature was raised, melting was clearly indicated by the disappearance of the lattice modes. These advances allowed the authors to carry out an accurate determination of the melting curve between 20 and 300 GPa.
Below 140 GPa, the data, while less noisy, are in agreement with previous measurements. However, in the 140–300 GPa range, where few data points from previous experiments are available, the melting line obtained by Zha et al. does not match any of the recent theoretical predictions (see Fig. 1). The peak temperature of the melting curve is lower than predicted, and the slope of the curve, while negative as expected, is smaller than theorists had calculated. The data also show that the melting line’s slope changes near 140 GPa. This slope change usually indicates a triple point—a point where the melt coexists with two different solid or liquid phases. The researchers found other supporting evidence for such a triple point, which was unexpected. Specifically, the frequency and width of the vibron mode have a discontinuous shift around 135 GPa. A similar discontinuity at 230 GPa may point to another unexpected phase change at higher pressure.
While these findings are surprising, the discrepancies with theory can be explained by the limitations and assumptions of current theoretical tools. An accurate theoretical description of melting must capture the structure and thermodynamics of both the solid and the liquid phase. Typically, researchers model such quantities using methods based on density-functional theory (DFT), whose accuracy is sensitive to the parameters chosen to approximate the so-called exchange-correlation functional. Such parameters are usually constrained by experimental data [11], which, prior to this study, were too scarce in this part of the phase diagram. What’s more, DFT methods cannot account for quantum effects associated with the ions’ zero-point motion—the residual motion in a particle's lowest allowed energy state. The new data will thus be essential to guide the refinement of theories that describe hydrogen under extreme conditions.
An intriguing additional result of Zha et al.’s experiment is the observation of a new high-temperature vibron mode at 300 GPa, appearing at temperatures above 373 K. Theoretical analysis indicates that this mode may be consistent with a metallic form of hydrogen. Could such a phase be the recently reported, lower-temperature metallic phase of hydrogen [12], and possibly be associated with superconductivity or superfluidity? Answering this question will require additional measurements of the optical and electrical conductivity under these conditions.
Acknowledgment
This work was performed under the auspices of the U.S. Department of Energy by Lawrence Livermore National Laboratory under Contract No. DE-AC52-07NA27344 Lawrence Livermore National Security, LLC.
This research is published in Physical Review Letters.
References
- E. Wigner and H. B. Huntington, “On the Possibility of a Metallic Modification of Hydrogen,” J. Chem. Phys. 3, 764 (1935).
- N. W. Ashcroft, “Metallic Hydrogen: A High-Temperature Superconductor?,” Phys. Rev. Lett. 21, 1748 (1968).
- C.-S. Zha, H. Liu, J. S. Tse, and R. J. Hemley, “Melting and High P−T Transitions of Hydrogen up to 300 GPa,” Phys. Rev. Lett. 119, 075302 (2017).
- F. Datchi, P. Loubeyre, and R. LeToullec, “Extended and Accurate Determination of the Melting Curves of Argon, Helium, Ice (), and Hydrogen (),” Phys. Rev. B 61, 6535 (2000).
- E. Gregoryanz, A. F. Goncharov, K. Matsuishi, H. Mao, and R. J. Hemley, “Raman Spectroscopy of Hot Dense Hydrogen,” Phys. Rev. Lett. 90, 175701 (2003).
- S. Deemyad and I. F. Silvera, “Melting Line of Hydrogen at High Pressures,” Phys. Rev. Lett. 100, 155701 (2008).
- M. I. Eremets and I. A. Trojan, “Evidence of Maximum in the Melting Curve of Hydrogen at Megabar Pressures,” JETP Lett. 89, 174 (2009).
- N. Subramanian, A. F. Goncharov, V. V. Struzhkin, M. Somayazulu, and R. J. Hemley, “Bonding Changes in Hot Fluid Hydrogen at Megabar Pressures,” Proc. Natl. Acad. Sci. 108, 6014 (2011).
- R. T. Howie, P. Dalladay-Simpson, and E. Gregoryanz, “Raman Spectroscopy of Hot Hydrogen above 200 GPa,” Nat. Mater. 14, 495 (2015).
- A positive slope of the melting curve is implied by the so-called Lindemann criterion, which states that a material will melt when the thermal motion of the atoms exceeds some fraction of the interatomic distance. Normally, a pressure increase leads to an increase in lattice stiffness, which in turn reduces thermal motion. This effect leads to higher melting temperatures at higher pressures..
- M. D. Knudson, and M. P. Desjarlais, “High-Precision Shock Wave Measurements of Deuterium: Evaluation of Exchange-Correlation Functionals at the Molecular-to-Atomic Transition,” Physical Review Letters 118, 035501 (2017).
- R. P. Dias and I. F. Silvera, “Observation of the Wigner-Huntington Transition to Metallic Hydrogen,” Science 355, 715 (2017).


