Twinkle, Twinkle, Star No More
The turbulent swirling of air in Earth’s atmosphere can cause incoming light from stars to twinkle, much to the frustration of ground-based-telescope operators. Being able to predict the properties of this optical disturbance could help observatory personnel to optimize telescope design, better schedule observations, and even select future telescope locations—factors that could all improve the data that scientists collect. At the SPIE Astronomical Telescopes and Instrumentation conference in Montreal in July 2022, researchers from three different groups presented new tools that could allow atmospheric turbulence to be forecast at various spatial scales up to a few hours in advance. Doing so could help telescope operators better mitigate the effects of turbulence on telescope measurements, improving the data that they collect.
The temperature gradients within the air, the topography of Earth’s surface, and the shear of the wind all contribute to create atmospheric turbulence—small-scale, chaotic air swirls characterized by winds that vary in speed and direction. Air-density variations within these swirls give the atmosphere a refractive index (a parameter that determines how the air bends light) that varies rapidly in space and time. Such a highly inhomogeneous refractive index distorts images of astronomical objects taken from the ground. To correct for these distortions, users can adjust the shapes of some mirrors in the telescopes in such a way that it effectively “undoes” the atmospheric distortions. This method works best when the turbulence is weak, says James Osborn, an atmospheric physicist at Durham University, UK. If the turbulence is strong, as is the case when a big weather front comes through, the data can require an extensive postprocessing that includes making complex on-sky measurements to tease out the details of the site’s turbulence. In extreme cases, the data may have to be thrown out.
Forecasting turbulence could help avoid such data loss. Scientists could “save an hour’s worth of observing time” by better optimizing the configuration of the telescopes’ optical components using forecast data, when available, Osborn says. The three tools presented all make those forecasts: one tool does so on a global scale, another aims for rapid time measurements, and one gleans information from real-time weather parameters.
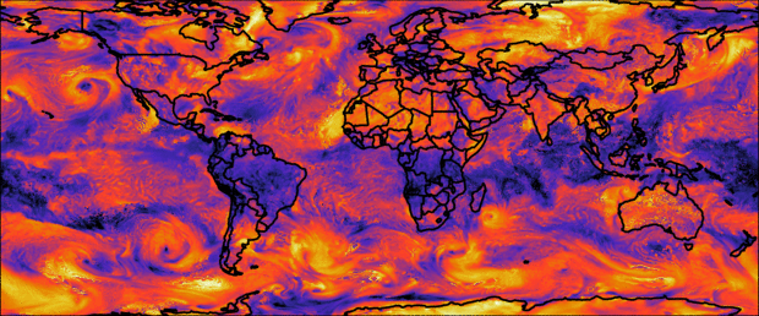
The tool developed by Osborn and colleagues uses global-scale meteorology models to convert weather data into global atmospheric-turbulence maps. The team started with atmospheric meteorological data from the European Centre for Medium-Range Weather Forecasts that included vertical profiles of air temperature, pressure, and humidity; and measurements of wind speed and velocity taken hourly at fixed weather stations. They then plugged this data into a model that calculated how the air’s temperature and density, and thus its refractive index, varied as a function of the horizontal distance between two points. The team tested the model using archived observation data. Comparing their predictions to observations made above Paranal Observatory in Chile and in London for the same time frame, they found that the model could predict global turbulence patterns a few days in advance.
Osborn says that their forecast tool could enable more efficient site selection for future observatories, as it would allow planners to predict conditions at different sites and then use that information to select the location where turbulence was most likely to be low, or at least consistent. The tool could also aid in optimizing observing schedules for exoplanets, for example, which require very calm air conditions because of the faintness of exoplanet signals relative to their bright host stars.
While Osborn and colleagues opted to make a global-scale model that can predict the properties of the atmosphere above any observatory, Elena Masciadri of the Italian National Institute of Astrophysics (INAF) and her colleagues used atmospheric models that have subkilometer horizontal resolution and are designed to simulate the conditions above specific geographical locations.
The INAF team’s original model has been running at the Large Binocular Telescope at Mount Graham International Observatory in Arizona since 2016, forecasting local atmospheric conditions on timescales of either a day or one to two hours in the future. But the team wanted to improve the accuracy of the predictions. They have now done that by combining statistical and machine-learning techniques with real-time measurements.
The one-to-two-hour outlook of their forecasts means that the information provided by the model is relevant to optimizing data-taking at the Large Binocular Telescope, Masciadri says. She and the team now plan to develop a similar model to predict atmospheric turbulence above the Very Large Telescope in Chile.
In a third approach discussed at the meeting, Ryan Dungee of the University of Hawaii at Hilo presented a model that can identify the height of a turbulent swirl using real-time observations of wind speed and direction. This information could allow observatories to leverage information about the spatial distribution of turbulence to improve performance. To test the model, a research team used wind speed and direction data from local weather stations and balloon launches above the Maunakea Observatory in Hawaii. They then ran their model to map the altitudes of different turbulent layers based on measured winds. They found that they could separate surface layer turbulence (up to 200 m above ground level) from free-atmosphere turbulence (200 m to 2 km above ground level) on 67% of the days that they tested. Dungee says that the data his model provides could help reduce operational costs, as it uses existing wind measurements to determine different turbulent layers and doesn’t need the expensive tools currently used to actively measure those layers. “Knowing which layers contain the most turbulence could lead to cheaper systems overall,” Dungee says.
The forecasts and corrections provided by the three models also offer benefits beyond astronomy, the researchers say. As well as space observations, turbulence can hinder free-space optical communications, which use laser beams to transmit information from the ground to satellites. Turbulence can cause the beams to flicker or spread, distorting the received signal. “But if you know that the strongest turbulence is always at a certain height above the ground, you can design a system to take this into account,” Osborn says. “So, it all comes together.”
–Rachel Berkowitz
Rachel Berkowitz is a Corresponding Editor for Physics Magazine based in Vancouver, Canada.