The boson peak demystified?
Researchers have known for more than four decades that the density of vibrational states (DOS) of amorphous materials differs in a characteristic way from that of crystalline ones [1]. In crystals, the low frequency DOS, g(ω), follows the so-called Debye model well; that is, by simple counting of possible sound waves compatible with the boundary conditions one obtains the frequency dependence of the DOS, g(ω)∝ω2. In contrast, amorphous materials show an excess contribution at low frequencies. This is usually identified in a reduced DOS representation, g(ω)/ω2 vs ω, which shows a peak which can be detected experimentally by methods like inelastic neutron scattering or nuclear inelastic scattering. At the time of its discovery, little was known about this feature other than its bosonic character, so it became known as the “boson peak” (BP). Since then, the origin of the BP has remained a puzzle, but experimental work now reported in Physical Review Letters by Aleksandr Chumakov and colleagues at the European Synchrotron Radiation Source, France, and collaborators in Germany, Italy, Poland, and the US, may have removed some of the mystery [2].
Over time, several competing explanations have been put forward, which can be roughly classified in two categories: (i) The modes giving rise to the BP are (quasi)localized [3] and distinct from sound waves and arise from peculiarities of the interatomic forces in amorphous materials, such as the group of atoms subject to soft potentials (with a low harmonic component) [4]. (ii) The DOS of the amorphous system is just a modification of the crystalline DOS due to a random fluctuation of force constants [5]. In the latter picture, the BP would “only” be the broadened version of a well-known phenomenon in the corresponding crystalline system called a Van Hove singularity [6]. This kind of singularity is characteristic for excitations in a periodic structure. It can be seen even in the textbook example of the linear chain. There the frequency is proportional to the sine of the wave vector. Therefore frequencies close to the maximum occur much more often than the low sound frequencies. The notion here is that this singularity persists to a certain degree also in the amorphous material.
Many of the systems in which a BP has been measured are glasses in the narrower sense—that is, they show a glass transition, which is a continuous change of the amorphous material into a liquid. This “transition” is not located at a well-defined temperature as it is for the melting of a crystal. Nevertheless, it is accompanied by an enormous decrease of the viscosity in a narrow temperature interval. Conventionally, the glass transition temperature is defined at a viscosity of 1012 pascal-seconds corresponding to a dynamic time scale of about 100s. The strong temperature dependence is usually called “fragility” [7], being less expressed in “strong” glasses (e.g., silicate glasses) and more in “fragile” ones (e.g., polymers).
Although the characteristic frequency of the BP lies in the terahertz range, precluding its immediate significance for the glass transition, there is strong evidence for the relevance of the BP for the glass transition. Qualitatively, materials with a well-pronounced BP fall into the category of strong glasses while those with a weak BP are mostly fragile [8]. Recently, a close correlation between BP modes and the structural instabilities relevant near the glass transition has been established for colloidal glasses [9]. Therefore some hope exists that the clarification of the BP origin may also help to solve an even older problem, namely to explain the peculiarities of the glass transition.
Chumakov et al. present a study of the BP by nuclear inelastic scattering, an extension of Mössbauer spectroscopy, which allows measurement of the energy spectrum of vibrations in a solid containing isotopes with a suitable nuclear transition, here 57Fe. Their results [2] address the central question of the origin of the BP and provide strong arguments for the second approach mentioned, an explanation of the BP in terms of (modified) sound waves. For this purpose, the authors compare the DOS of a sodium-iron silicate glass at different pressures and also make a comparison to a well-chosen crystalline analog. The glass shows a typical BP at 5– 7meV, while the DOS of the crystal follows the Debye model in this range, with the reduced DOS only increasing towards the transverse acoustic (TA) Van Hove singularity at 10meV. The BP is (depending on pressure) 2– 4 times higher than the Van Hove maximum. So at first glance, the reduced DOS plot seems to provide evidence for new and distinct additional modes constituting the BP.
This picture changes completely when the authors perform a more quantitative analysis of their experimental data. The number of excess modes extracted from the difference of the (nonreduced) DOS and the Debye model expectation gives the same value for glass and crystal. So the pronounced amplitude of the BP can be viewed as a result of the reducing factor 1/ω2. The modes are just shifted to lower frequency by level repulsion giving them more weight in the reduced representation. Also the ratio of the peak height to the Debye level is the same for the glass at all pressures and also for the crystal.
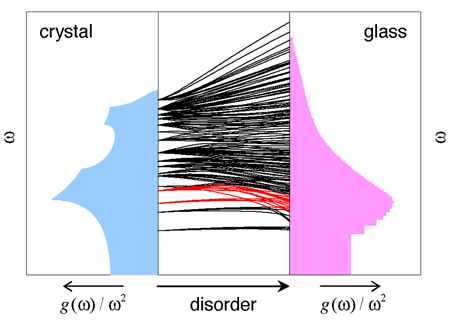
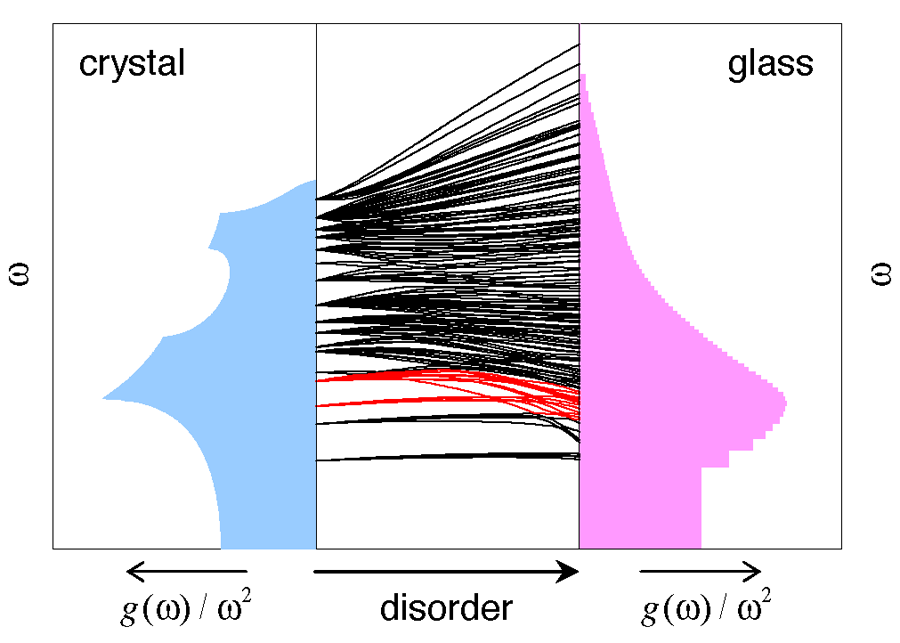
The results found in Chumakov et al.’s work clearly support an explanation of the BP in terms of (predominantly) transverse sound waves rather than new modes. This is very much in the spirit of models that start from crystalline systems and then obtain a BP just by introducing a disorder of force constants, as in the work of Schirmacher et al. [5]. Figure 1 shows the result for such a model when the disorder is increased. The DOS continuously changes from that of a crystal into one with a boson peak. On following individual modes one can even see that those close to the transverse Van Hove singularity evolve into those of the BP. (Of course, this results from a naive assignment of mode identity at crossing points.)
Recent support for this picture arose because it is able to explain the effect of confinement on the BP [10]. Several experimental studies have shown that the low frequency wing of the BP is suppressed if a glass is confined in a less elastic matrix [11]. This can be simply explained by a shift of sound modes in a resonator with respect to those in the bulk. A rescaling formula derived from this idea can quantitatively explain the BP confinement effect.
The results so far seem somewhat disappointing concerning the initial hope to identify certain “glass modes” within the BP that are connected to the high-temperature properties. But one has to be careful because, as the authors of the present Letter wisely concede: ”The suggested assignment of the boson peak to the TA branch does not mean that one can understand the boson peak in terms of only transverse waves.”
Indeed, a deeper explanation of the effect of disorder on the sound waves may arise from quasilocalized modes. Although in a strict sense the modes are extended, they can be decomposed into a localized and a sound-wave-like part, which are coupled [12]. Such a picture, in addition to the explanatory benefit, avoids the negative eigenvalues that are nearly inevitable in models like the one shown in Fig. 1, which assume pure randomness.
On the other hand, the proponents of localized modes as the origin of the BP also acknowledge that the excess vibrations are of mainly transverse character [13]. So it seems that a reconciliation of both pictures will be possible in the future.
The work of Chumakov et al. presents strong arguments for the close relation of transverse sound waves in crystals to the boson peak in glasses. But this does not mean that the initial discussion is settled. Rather, the question of a universal origin of the transformation of the TA Van Hove singularity into the BP is left open and localized modes may well play a role in the answer.
References
- Amorphous Solids: Low-Temperature Properties, edited by W. A. Phillips (Springer, Berlin, 1981)[Amazon][WorldCat]
- A. I. Chumakov et al., Phys. Rev. Lett. 106, 225501 (2011)
- E.g., B. B. Laird, and H. R. Schober, Phys. Rev. Lett. 66, 636 (1991)
- V. G. Karpov, M. I. Klinger, and F. N. Ignatiev, Sov. Phys. JETP 57, 439 (1983)
- E.g., W. Schirmacher, G. Diezemann, and C. Ganter, Phys. Rev. Lett. 81, 136 (1998)
- S. N. Taraskin, Y. L. Loh, G. Natarajan, and S. R. Elliott, Phys. Rev. Lett. 86, 1255 (2001)
- C. A. Angell, Science 267, 1924 (1995)
- A. P. Sokolov, R. Calemczuk, B. Salce, A. Kisliuk, D. Quitmann, and E. Duval, Phys. Rev. Lett. 78, 2405 (1997)
- K. Chen, M. L. Manning, P. J. Yunker, W. G. Ellenbroek, Zexin Zhang, A. J. Liu, and A. G. Yodh, arXiv:1103.2352v1
- R. Zorn, Phys. Rev. B 81, 054208 (2010)
- E.g., A. I. Chumakov, I. Sergueev, U. van Bürck, W. Schirmacher, T. Asthalter, R. Rüffer, O. Leupold, and W. Petry, Phys. Rev. Lett. 92, 245508 (2004)
- H. R. Schober and C. Oligschleger, Phys. Rev. B 53, 11469 (1996)
- H. R. Schober, J. Phys. Condens. Matter 16, S2659 (2004)


