How Glaciers Set a Table
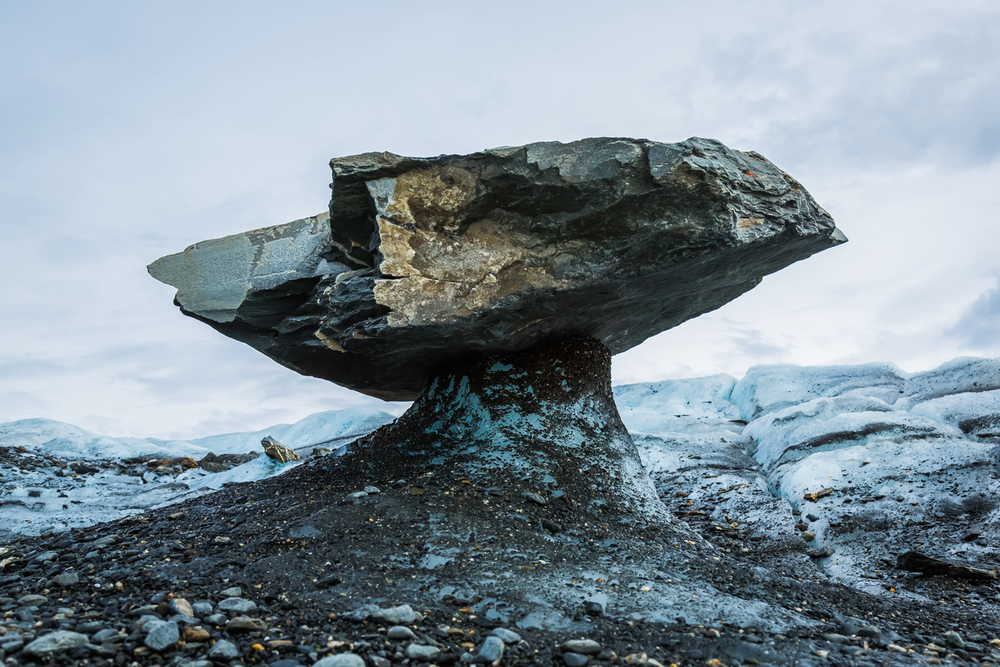
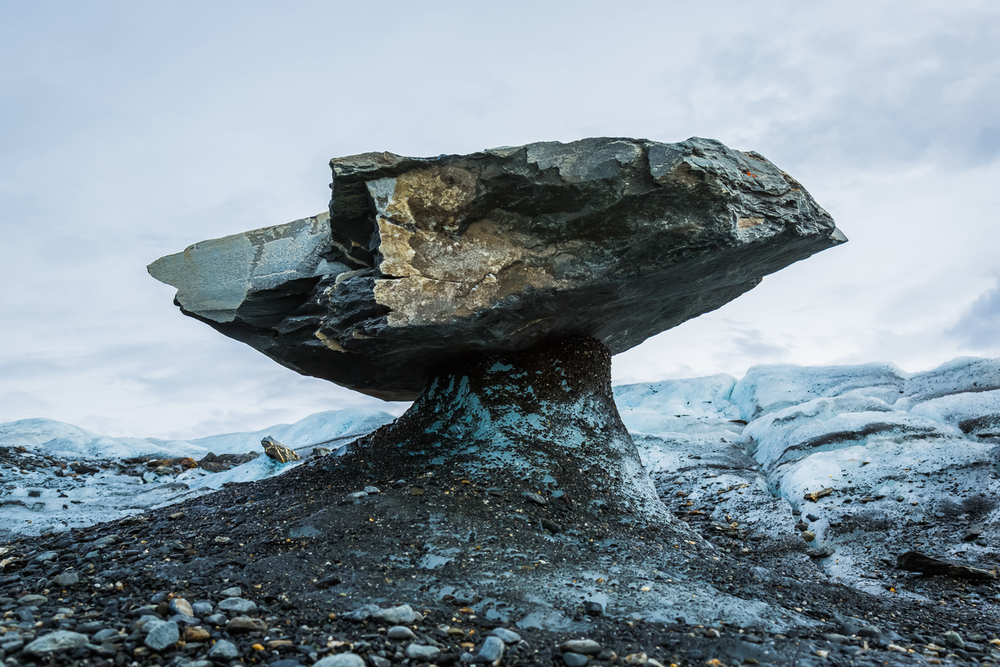
A glacier table—a large stone sitting precariously on top of a narrow pedestal of ice—is a common sight on low-altitude glaciers. A new study provides an explanation for how these features form [1]. Based on experiments with stones of different shapes and materials, researchers found that the surface area and the heat conduction of the stone are two important properties controlling whether a table forms or not. By incorporating these properties into a model, the team estimated the minimum rock size required for a table to form, finding a value consistent with observations. The model could allow glacier tables to provide a rough gauge of glacier melting in cases where traditional monitoring equipment is not available.
Glacier tables typically occur at altitudes below about 10,000 feet, where summer temperatures can be warm enough to melt ice. A large rock or boulder lying on top of the glacier can slow the melting of ice directly beneath it. This protected ice forms a pedestal—often reaching 1–2 meters in height—that supports the rock as the surrounding ice melts away. Usually, glacier tables last only a few months, with the rock tipping over once the pedestal diameter becomes too small.
Nicolas Taberlet encountered glacier tables as a mountaineering enthusiast. “I came across them a number of times and always thought that they were interesting,” he says. A physicist at the University of Lyon, France, Taberlet wondered why large rocks often form tables, while smaller rocks typically sink into the ice. So he and his colleagues designed laboratory experiments with 3-cm-thick plates of clear ice that were inclined at various angles to resemble miniature glaciers.
The researchers first measured the ice melting in the lab by tracking the thickness of the plates over time. They showed that the ice warming was caused mainly by radiation from the lab walls and by convection in the ambient air. Less important was liquid water runoff. These results were consistent with observations that the team had made earlier on real glaciers.
The team then tested a variety of cylindrical stones by placing them on top of the ice and tracking them for several hours. Each stone was made from one of six materials that differ in their heat conductance, from polystyrene, the weakest conductor, to granite, the strongest. The stones were between 4 and 14 cm in diameter and between 0.5 and 7 cm in height.
Some of the stones formed tables, while others sank below the ice surface. Heat conduction was one factor, as demonstrated by the fact that ice pedestals formed under polystyrene stones but not under granite stones. Polystyrene is a better “blanket,” shielding the ice from the warm environment.
Another factor was the shape, with thinner stones forming tables more easily than thicker stones. The researchers described this behavior as a geometry-induced amplification of melting: a thicker stone has more surface area in contact with the environment, so it absorbs more heat, which causes the ice below to melt faster than the ice under a thinner stone. Taberlet explains that a similar effect (with heat flowing in the opposite direction) allows high-surface-area “fins” to speed up the emission of excess heat from engines and electronic components.
The team combined the conductivity and the geometric amplification effects into a generic formula for determining whether ice covered by a stone will melt faster or slower than uncovered ice. Using this formula, they estimated that the minimum size for a rock to form a table is 10–20 cm, which is consistent with observations that most tables on glaciers are 1 m or more in width.
With further study of glacier tables, scientists might be able to use them as glacier benchmarks. “If you don’t have the means to track a glacier continuously, you could simply go there every month of June, say, and measure the height of the glacier tables,” Taberlet says. Such data could be converted into an estimate of the melting rate. An understanding of glacier tables could also come in handy on Jupiter’s moon Europa—a future mission to this icy world might have to worry that its lander would behave like a rock on a glacier, altering the melting rate beneath it.
The experiments and field observations provide a good explanation of the environmental conditions that lead to glacier tables, says Bhanu Pratap, a glaciologist from the Wadia Institute of Himalayan Geology in India. But he believes more studies are needed to understand the effects of “debris,” such as rocks, dirt, and pollution, on glacier evolution.
–Michael Schirber
Michael Schirber is a Corresponding Editor for Physics Magazine based in Lyon, France.
References
- M. Hénot et al., “Onset of glacier tables,” Phys. Rev. Lett. 127, 108501 (2021).


