Getting a Heads-Up on Landslides from Space
Landslides kill thousands of people each year. Knowing in advance when these sudden ground shifts might happen could help save lives and mitigate damages. A new study demonstrates the potential of using satellite data to forecast when a slowly shifting hillside might fail catastrophically [1]. By analyzing archival data from the site of a recent California landslide, researchers identified small but coordinated ground movements during several months leading up to the site’s collapse. Tracking land movement in this way shows promise as an early warning system, as the researchers were able to spot anomalous behavior in the ground movements about eight weeks prior to the landslide.
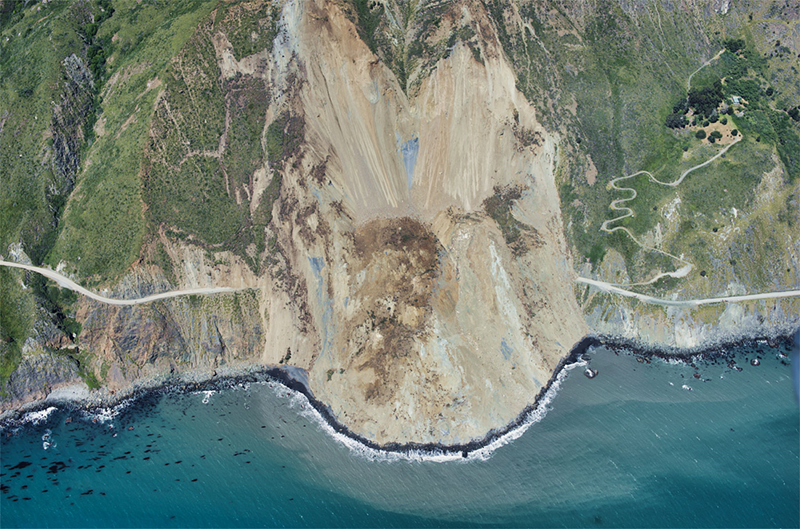
The Mud Creek landslide occurred along the central California coast on May 20, 2017. The collapse released over a million tons of rock and debris, destroying a section of California Highway 1. No lives were lost, but the estimated repair costs were $54 million. “The weird thing was that it failed on a dry day, not even during the heavy rainfall season,” says Vrinda Desai, a graduate student from North Carolina State University. A postanalysis of remote-sensing data revealed that for eight years before the catastrophe, the Mud Creek slope had been slowly moving downhill, or “creeping,” at an average rate of 17 cm per year [2].
Creeping landslides are common, especially in California where more than 650 have been identified. These landslides may persist for years without a sudden collapse. But the slopes that make up these regions are inherently unstable. Geologists can keep tabs on them with routine visual inspections and motion detectors, but a more practical method uses satellite imagery. “In terms of accessibility and applicability, remote-sensing data is the way to go,” Desai says.
One popular remote-sensing method is interferometric synthetic aperture radar (InSAR), which can monitor changes in Earth’s surface elevation. Here, a satellite emits radar signals at a target region and records the time it takes for the signal to reflect off the ground and return to the satellite. A few days or weeks later, the satellite makes another pass and again records the reflection time. By comparing these two sets of data, researchers can measure how much the ground has risen or fallen in a particular area—and determine whether swathes of land are shifting downhill together. “That movement is basically the displacement that’s occurred between the first snapshot and the second snapshot,” Desai says. InSAR can provide maps of ground movement with resolution down to millimeter scale.
“It really is mind boggling to think that InSAR can ‘see’ ground deformation to centimeter-millimeter accuracy all the way from space,” says Antoinette Tordesillas, a landslide researcher from the University of Melbourne in Australia, who was not involved in the new study. InSAR data have been used since the 1990s to spot and track creeping landslides, but the key challenge has been figuring out how best to interpret that satellite information, Tordesillas says. Some researchers have found indicators of impending collapse, such as increasing rates of downslope movement, but they tend to be specific to a particular region. Desai and her colleagues have come up with a general method to evaluate landslide risk based on network science, which is traditionally used to study relationships in biology and sociology. “The application of network science to forecast natural hazards is a fresh approach,” Desai says.
As a demonstration, Desai and her colleagues obtained InSAR data of the Mud Creek region that was taken by the Copernicus Sentinel-1A and -1B satellites over an 800-day period prior to the 2017 landslide. They focused on a 3 × 3-km2 area enclosing Mud Creek and selected around 5000 ground locations, or “nodes,” as their targets. They then applied a network model, which tracked how each node moved relative to neighboring nodes. Desai compares it to how researchers study social networks. “Within a social network, you can analyze the relationships between people and identify communities within the group,” she says. “We’re doing the same thing, but on a geological scale.”
The researchers showed that their analysis selected out a small subregion centered at the Mud Creek site as a “community” in which the nodes moved largely in unison. To evaluate this behavior, they developed a parameter called community persistence, which basically measures how well a community sticks together relative to other communities in the same focus area. The team showed that this parameter fluctuated around an average value for most of the survey period. However, 56 days before the Mud Creek landslide, the parameter jumped to a value about 30% above the average. This suggests that community persistence could act as a red flag for regions that may be at high risk for catastrophic failure.
But the Mud Creek analysis is just one test case. The researchers will need to show that their method works in a wider variety of geological conditions. Desai and her colleagues are now working on a much bigger dataset from a larger area around the Mud Creek site. They’ve identified about two dozen creeping landslides in this area, and they will be looking for signs of unusual activity using their network-based analysis.
“The network analysis approach by Desai and colleagues represents a novel and creative methodology for landslide hazard forecasting using surface deformation data,” says landslide specialist Jonathan Perkins from the US Geological Survey in California. Both he and Tordesillas agree that this type of approach could offer a way of monitoring large areas and providing advance warning of potential hazards. But Perkins cautions that this study only covers one event out of the diverse catalog of known catastrophic landslides. “It will thus be very interesting to see in future work whether these intriguing signals of imminent failure are common,” he says.
–Michael Schirber
Michael Schirber is a Corresponding Editor for Physics Magazine based in Lyon, France.
References
- V. D. Desai et al., “Forecasting landslides using community detection on geophysical satellite data,” Phys. Rev. E 108, 014901 (2023).
- A. L. Handwerger et al., “A shift from drought to extreme rainfall drives a stable landslide to catastrophic failure,” Sci. Rep. 9, 1569 (2019).