Tracking Down an Epidemic’s Source
Epidemiologists often have to uncover the source of a disease outbreak with only limited information about who is infected. Mathematical models usually assume a complete dataset, but a team reporting in Physical Review Letters demonstrates how to find the source with very little data. Their technique is based on the principles used by telecommunication towers to pinpoint cell phone users, and they demonstrate its effectiveness with real data from a South African cholera outbreak. The system could also work with other kinds of networks to help governments locate contamination sources in water systems or find the leaders in a network of terrorist contacts.
A rumor can spread across a user network on Twitter, just as a disease spreads throughout a network of personal contacts. But there’s a big difference when it comes to tracking down the source: online social networks have volumes of time-stamped data, whereas epidemiologists usually have information from only a fraction of the infected individuals.
To address this problem, Pedro Pinto and his colleagues at the Swiss Federal Institute of Technology in Lausanne (EPFL) developed a model based on the standard network picture for epidemics. Individuals are imagined as points, or “nodes,” in a plane, connected by a network of lines. Each node has several lines connecting it to other nodes, and each node can be either infected or uninfected. In the team’s scenario, all nodes begin the process uninfected, and a single source node spreads the infection from neighbor to neighbor, with a random time delay for each transmission. Eventually, every node becomes infected and records both its time of infection and the identity of the infecting neighbor.
To trace back to the source using data from a fraction of the nodes, Pinto and his colleagues adapted methods used in wireless communications networks. When three or more base stations receive a signal from one cell phone, the system can measure the difference in the signal’s arrival time at each base station to triangulate a user’s position. Similarly, Pinto’s team combined the arrival times of the infection at a subset of “observer” nodes to find the source. But in the infection network, a given arrival time could correspond to multiple transmission paths, and the time from one transmission to the next varies randomly. To improve their chances of success, the team used the fact that the source had to be one of a finite set of nodes, unlike a cell phone user, who could have any of an infinite set of coordinates within the coverage area.
The team evaluated their method with four different types of network structures and with two different methods for choosing observer nodes. Each network type is different in the way that it specifies the number of connections between nodes, and all four types are commonly used in network research. For each network type, the researchers either chose observer nodes randomly or chose them from among the nodes with the most connections. They found that choosing observers with many connections proved significantly more effective. For one of the networks, random selection required percent of the nodes to act as observers before the team could determine the source with percent confidence. On the other hand, choosing well-connected observers required information from only percent of the nodes for the same level of confidence.
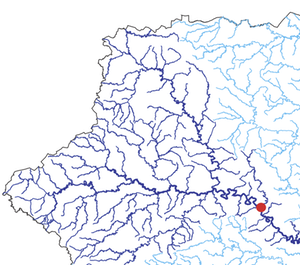
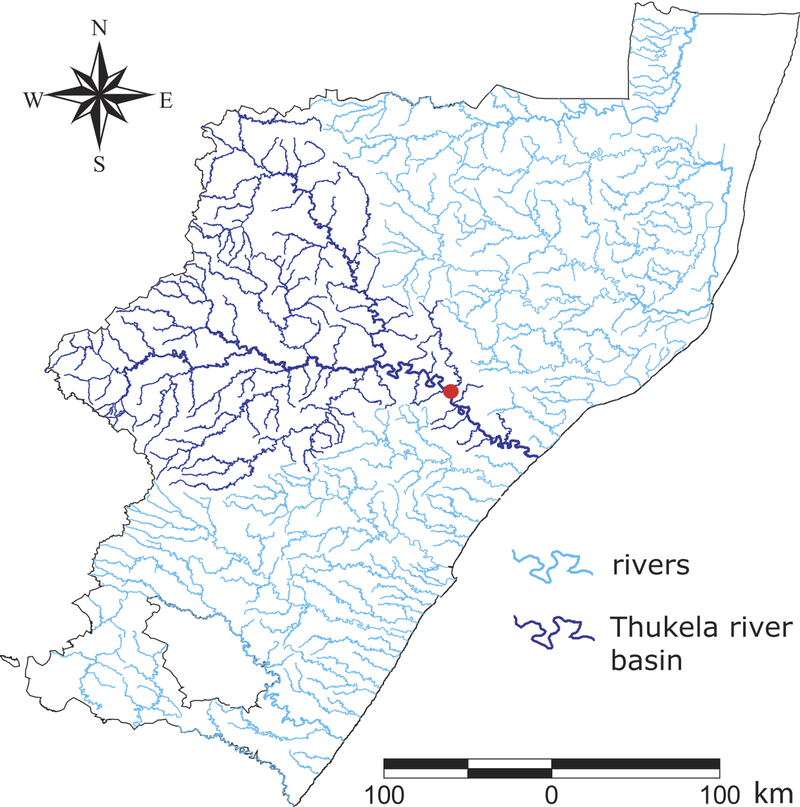
The team also tested their technique on real data from a South African cholera outbreak that occurred in 2000, using nodes to represent villages connected by a network of rivers. Even when the “observer” villages were chosen randomly and represented just 20 percent of the total, the team predicted the source village to within four jumps. Pinto says his team will further investigate the optimal way to select these villages.
This research lays the groundwork for future epidemiological models on sparse data, says Tauhid Zaman, a network researcher at the Massachusetts Institute of Technology in Cambridge who specializes in source location. Future research could expand on the method to include multiple chains of infection, he adds. Pinto says the technique could also be useful for other network problems, such as tracing a contaminant in a subway system or finding the source of a computer virus.
–Brian Jacobsmeyer
Brian Jacobsmeyer is the science writing intern at APS.


