Subway Stats
While commuters in New York City fume over a bout of subway delays, two researchers have used statistical models to take calmer stock of the trains’ performance. The analysis, reported by Aukosh Jagannath of the University of Toronto and Thomas Trogdon of the University of California, Irvine, might provide a mathematical tool for assessing subway improvements.
The duo’s work was inspired by a 2000 study of buses in Cuernavaca, Mexico, where bus drivers own the vehicles and operate them to maximize profits. In a city like Cuernavaca, which has unpredictable traffic, one might have expected the times between arriving buses to have random values that don’t follow a discernible pattern. But the study instead found a more predictable distribution of times that was best described by random-matrix theory (RMT), a widely used statistical approach for describing complex systems (such as heavy nuclei). This RMT distribution suggested an effective “interaction” between the buses, perhaps resulting from the drivers being more efficient by competing with one another.
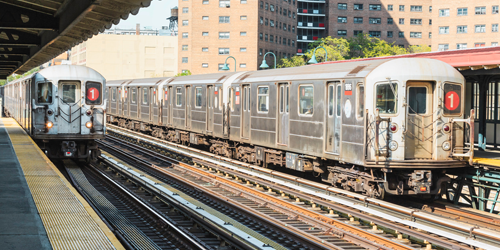
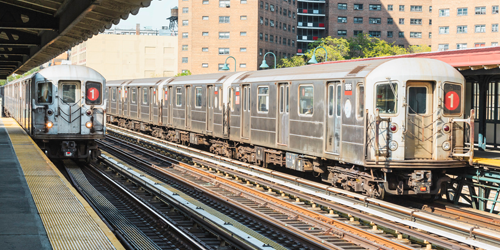
Whether RMT-like statistics describe New York City’s subways—which are subject to more control than Cuernavaca’s buses—might also be an indicator of how efficiently they are run. Jagannath and Trogdon used the city’s live transit feed to determine the times between arriving trains at stations on two “local” line routes, the 1 and the 6. They then subtracted the 90-second delay between train arrival times that’s mandated by the city’s transit authority. The statistical distributions of the corrected time gaps revealed telling differences between the two lines. The gaps on the 6 line had random values. But for the southbound part of the 1 line, the distribution was best described by RMT—potentially suggesting a more efficiently run line.
This research is published in Physical Review E.
–Jessica Thomas
Jessica Thomas is the Editor of Physics.


